UNITED STATES
SECURITIES AND EXCHANGE COMMISSION
Washington, D.C. 20549
SCHEDULE 14A
Proxy Statement Pursuant to Section 14(a) of the
Securities Exchange Act of 1934
(Amendment No.)
| ☐ | Preliminary Proxy Statement |
| ☐ | Confidential, for Use of the Commission Only (as permitted by Rule 14a-6(e)(2)) |
| ☑ | Definitive Proxy Statement |
| ☐ | Definitive Additional Materials |
| ☐ | Soliciting Material Pursuant to §240.14a-12 |
MANHATTAN ASSOCIATES, INC.
(Name of Registrant as Specified in Its Charter)
Not Applicable
(Name of Person(s) Filing Proxy Statement, if other than the Registrant)
Payment of Filing Fee (Check the appropriate box):
| ☑ | No fee required. |
| ☐ | Fee computed on table below per Exchange Act Rules 14a-6(i)(4) and 0-11. |
| (1) | Title of each class of securities to which transaction applies: |
|
|
|
| ||
(2) | Aggregate number of securities to which transaction applies: | |
|
|
|
| (3) | Per unit price or other underlying value of transaction computed pursuant to Exchange Act Rule 0-11 (set forth the amount on which the filing fee is calculated and state how it was determined): |
|
|
|
| ||
(4) | Proposed maximum aggregate value of transaction: | |
|
|
|
| ||
(5) | Total fee paid: |
| ☐ | Fee paid previously with preliminary materials. |
| (1) | Amount Previously Paid: |
|
|
|
| ||
(2) | Form, Schedule or Registration Statement No.: | |
|
|
|
| ||
(3) | Filing Party: | |
|
|
|
| (4) | Date File |
|
|
|
|
|
|
|
2 |
| |
| |
|
|
| |
| |
| |
| |
| |
| |
|
|
Security Ownership of Certain Beneficial Owners and Management |
|
Delinquent Section 16(a) |
|
| |
|
|
Proposal 2 – Resolution to Approve Named Executive |
|
| |
| |
| |
| |
| |
| |
| |
|
|
Proposal 3 – Ratification of Appointment of Independent Registered Public Accounting Firm |
|
| |
| |
|
|
Additional Information about the Annual Meeting of Shareholders |
|
| |
| |
| |
| |
| |
|
|

NOTICE OF ANNUAL MEETING OF SHAREHOLDERS
TO BE HELD MAY 17, 201813, 2021
Manhattan Associates Corporate Headquarters
2300 Windy Ridge Parkway, Atlanta, Georgia 30339
(770) 955-7070
NOTICE IS HEREBY GIVEN that the 20182021 Annual Meeting of Shareholders of Manhattan Associates, Inc. (the “Company,” “our,” “we” or “us”) will be held at 2300 Windy Ridge Parkway, Atlanta, Georgia 30339, at 9:00 a.m., Atlanta, GeorgiaEastern time, on Thursday, May 17, 201813, 2021 (the “Annual Meeting”), to consider and act upon:
| 1. | the election of three Class II Directors to the Company’s Board of Directors; |
| 2. | a nonbinding resolution to approve the compensation of the Company’s named executive officers; |
| 3. | a proposal to ratify the appointment of Ernst & Young LLP as the Company’s independent registered public accounting firm for the fiscal year ending December 31, |
| 4. | such other business as may properly come before the Annual Meeting or any adjournment of the meeting. |
The Board of Directors has fixed the close of business on March 21, 2018,19, 2021, as the record date for the determination of shareholders entitled to notice of, and to vote at, the Annual Meeting. For instructions on voting, please refer to the notice you received in the mail or, if you requested a hard copy of the proxy materials, on your enclosed proxy card.
| By Order of the Board of Directors, |
|
|
|
|
| Bruce S. Richards |
| Senior Vice President, Chief Legal Officer and Secretary |
April 4, 2018March 31, 2021
Atlanta, Georgia
We intend to hold the Annual Meeting in person, but we continue to monitor developments regarding the COVID-19 pandemic. Accordingly, it could become necessary to change the date, time, location or means of holding the meeting. If we determine that it is not possible or advisable to hold our Annual Meeting as currently planned, we will announce our change of plan in a press release, post the details on our website, and file the details with the SEC as proxy materials. If you plan to attend our Annual Meeting, please check our website the week of the meeting. As always, we encourage you to vote your shares prior to the meeting.
WHETHER OR NOT YOU EXPECT TO BE PRESENT AT THE MEETING, PLEASE SUBMIT YOUR VOTE THROUGH THE INTERNET OR BY TELEPHONE, OR IF YOU REQUESTED PAPER COPIES OF THE PROXY MATERIALS, YOU MAY VOTE BY MAIL BY FOLLOWING THE INSTRUCTIONS ON THE PROXY CARD. NO POSTAGE IS REQUIRED
2 
FOR MAILING IN THE UNITED STATES. IF YOU ATTEND THE MEETING, YOU MAY REVOKE YOUR PROXY AND VOTE YOUR SHARES IN PERSON.
IMPORTANT NOTICE REGARDING THE AVAILABILITY OF PROXY MATERIALS FOR THE SHAREHOLDER MEETING TO BE HELD ON MAY 17, 201813, 2021
This proxy statement, the form of proxy and annual report on Form 10-K for the fiscal year ended December 31, 20172020 (“20172020 Annual Report”) are being mailed to shareholders who have requested hard copies on or after April 4, 2018.March 31, 2021. Registered and beneficial shareholders may view and print this proxy statement and the Company’s 20172020 Annual report at www.proxyvote.com or in the Investor Relations section of the Company’s web site at www.manh.com.
2 3
This summary highlights information contained elsewhere in this Proxy Statement. For more information, please read our Annual Report on Form 10-K for fiscal year 20172020 and the entire Proxy Statement prior to voting.
ANNUAL MEETING OF SHAREHOLDERS |
Date and Time: | May |
Place: | Manhattan Associates Headquarters, 2300 Windy Ridge Parkway, Atlanta, GA 30339 |
Record Date: | March |
By Internet: Go to www.proxyvote.com;
By phone: Call 1-800-690-6903;
By mail: Call 1-800-579-1639 to request a paper copy of the materials and follow the instructions on your proxy materials; or
In person by attending the Annual Meeting of Shareholders.
To cast your vote by internet or phone, you will need the control number from your proxy card or the notice to our shareholders. We intend to hold the Annual Meeting in person, but we continue to monitor developments regarding the COVID-19 pandemic. Accordingly, it could become necessary to change the date, time, location or means of holding the meeting. If we determine that it is not possible or advisable to hold our Annual Meeting as currently planned, we will announce our change of plan in a press release, post the details on our website, and file the details with the SEC as proxy materials. If you plan to attend our Annual Meeting, please check our website the week of the meeting. As always, we encourage you to vote your shares prior to the meeting. |
|
4
MEETING AGENDA AND VOTING MATTERS |
Proposal | Proposal |
| Recommendation of the Board |
| Voting Standard |
| Page Number (for more details) | Proposal |
| Recommendation of the Board |
| Voting Standard |
| Page Number (for more details) |
1. | Election of three Class II Directors, each for a three-year term expiring in 2021. |
| FOR (each nominee) |
| Plurality of the votes cast, subject to policy requiring a nominee who is elected with less than a majority of the votes cast to offer to resign |
| 10 | Election of three Class II Directors, each for a three-year term expiring in 2024. |
| FOR (each nominee) |
| Plurality of the votes cast, subject to policy requiring a nominee who is elected with less than a majority of the votes cast to offer to resign |
| |
2. | Advisory vote to approve the compensation of our named executive officers. |
| FOR |
| Votes cast in favor exceed votes cast against |
| 23 | Advisory approval of the compensation of our named executive officers. |
| FOR |
| Votes cast in favor exceed votes cast against |
| |
3. | Ratification of appointment of Ernst & Young, LLP as our independent registered public accounting firm for the fiscal year ending December 31, 2018. |
| FOR |
| Votes cast in favor exceed votes cast against |
| 42 | Ratification of appointment of Ernst & Young LLP as our independent registered public accounting firm for the fiscal year ending December 31, 2021. |
| FOR |
| Votes cast in favor exceed votes cast against |
| |
|
|
|
|
|
|
|
|
|
|
|
|
|
|
|
35
|
|
|
|
|
| Committee Memberships |
|
|
|
|
|
|
| Committee Memberships | ||||||
Name, Primary Occupation | Age | Director Since | Current Term Expires | Expiration of Term For Which Nominated | Independent | Other Public Company Boards | Audit | Compensation | Nomination & Governance | Age | Director Since | Current Term Expires | Expiration of Term For Which Nominated | Independent | Other Public Company Boards |
| Audit | Compensation | Nomination & Governance | |
Eddie Capel President and CEO of Manhattan Associates, Inc. | 57 | 2012 | 2020 | - | No | None |
| 60 | 2012 | 2023 | - | No |
| 1 |
|
| ||||
Edmond I. Eger III CEO of Rewards Network Establishment Services, Inc. | 57 | 2015 | 2018 | 2021 | Yes | None | ✓ | 60 | 2015 | 2021 | 2024 | Yes | None |
| ü |
|
| |||
John H. Heyman CEO of SnapAV and Partner of Actuate Partners, LLC | 56 | 2016 | 2019 | - | Yes | None | ✓ | |||||||||||||
Linda T. Hollembaek Senior Vice President, Integration Management Officer of Lexmark International, Inc. (Retired) | 63 | 2018 | 2021 | 2024 | Yes | None |
|
| ü | |||||||||||
John J. Huntz, Jr. (Chairman) Managing Director of Huntz & Co., LLC | 67 | 1999 | 2019 | - | Yes | None | Chair | ✓ | 70 | 1999 | 2022 | - | Yes | None |
| Chair | ü | |||
Charles E. Moran Chairman and CEO of Skillsoft Corporation (retired) | 63 | 2017 | 2020 | - | Yes | None | ✓ | |||||||||||||
Thomas E. Noonan Partner of TechOperators, LLC; Chairman of Iconic Security, Inc. and TEN Holdings, LLC | 57 | 1999 | 2019 | - | Yes | 1 | ✓ | Chair |
| |||||||||||
Charles E. Moran Chairman and CEO of Skillsoft Corporation (Retired) | 66 | 2017 | 2023 | - | Yes |
| 2 |
|
| ü |
| |||||||||
Thomas E. Noonan General Partner of TechOperators, LLC; | 60 | 1999 | 2022 | - | Yes |
| 1 |
| ü | Chair |
| |||||||||
Deepak Raghavan Adjunct Professor at Georgia State University | 51 | 1998 | 2018 | 2021 | Yes | None |
| Chair | 54 | 1998 | 2021 | 2024 | Yes | None |
|
| Chair | |||
|
|
|
|
|
|
|
|
|
|
|
|
|
|
| ||||||
|
|
|
|
|
|
|
|
|
|
|
|
|
|
|
|
| ||||
| Number of Members | Independent | Number of Meetings During Fiscal Year | Number of Members | Independent | Number of Meetings During Fiscal Year |
Full Board | 7 | 86% | 5 | 7 | 86% | 6 |
Audit Committee | 3 | 100% | 4 | 3 | 100% | 4 |
Compensation Committee | 3 | 100% | 6 | 3 | 100% | 6 |
Nomination & Governance Committee | 3 | 100% | 4 | 3 | 100% | 5 |
6
|
WeAs we continue to transition to a cloud-first company, we believe 20172020 was a year of substantial progress in positioning the Company for future long-term sustainable growth. Entering 2021, we remain focused on driving revenue growth and gaining market share. We note however our objectives for the year are subject to a number of risks and uncertainties, including the ongoing effects of the novel coronavirus disease (“COVID-19”) pandemic on global commerce, as well as the other factors set forth in a challenging retail environment.Item 1A of the Company’s Annual Report on Form 10-K for the year ended December 31, 2020. We are confident in our long-term strategy driven by our market leadership in innovative supply chain and omnichannel solutions and services.
Among ourOur accomplishments we:include:
Continued to investAggressively investing in innovation and sought to expand ourexpanding total addressable market
| ✓ |
|
| ✓ | In May 2020, we launched our cloud-native Manhattan Active® Warehouse Management Solution, which we believe is the most advanced warehouse management system released in over a decade. The market reaction to this new product has been impressive with a double-digit number of deals closed to date and a growing pipeline. |
✓ | Our Manhattan Active® Solutions |
| ✓ |
|
4 
ExecutedRevenue and earnings performance was solid in a businessthe 3rd year of cloud transition and challenging retail macro environment
| ✓ | Total revenue was |
| ✓ | GAAP diluted EPS was $1.36, up 3% versus 2019, while Adjusted EPS was $1.76, up 1% versus 2019, reflecting our expense management. |
✓ | Customer retention rates were well above 90% |
| ✓ |
|
| ✓ | Recurring revenue as a percentage of total revenue, excluding hardware sales, rose from |
| ✓ |
|
✓ | 2020 GAAP operating margin of |
Maintained capital discipline and financial capacity
| ✓ | We closed |
| ✓ | Operating cash flow was |
| ✓ | In response to COVID-19, we took proactive measures to position the Company for uncertainty in the near-term. Those actions, effective April 1, 2020, included reduction of officer salaries and board of directors’ fees, suspension of our 401(k) plan company match, and suspension of our share repurchase program, all for the balance of 2020. |
✓ | We invested |
Our 2017 performance was influenced by delays in large investments in supply chain software by retail customers coupled with accelerated market adoption ofIn 2020, we exceeded our cloud-based subscription services, and its correlative negative effecttarget objectives (as defined on up-front revenue recognition when compared to traditional perpetual software licenses.page 32 As a result, we did not achieve our consolidated revenue objective) for our annual cash bonus program and the performance-based component of our long-term equity (restricted stock unit) program, resulting in a reduced payout of 49% of the target payout to the named executive officers forunder our annual cash bonus program of 108% of target to all participants including our NEOs, and a 0% payout toearned performance-based equity under the named executive officers forperformance-based component of our 2017 performance-based2020 long-term equity program grants.at 108% of target for all participants including our NEOs.
Our total shareholder return (“TSR”) for 2017 was negative seven percent (-7%). Based on the Company’s stock price at December 31, 2017, our CEO’s compensation was down 43%, and our NEO’s compensation collectively down 37% versus their 2017 compensation targets. Despite our TSR, the 7
The Board of Directors believes that the Company made substantial progress toward positioning the Company for long-term success, expanding its addressable market through meaningfully differentiated investment in innovation, and positioning Manhattan Associates for potential long-term sustainable growth.
CORPORATE RESPONSE TO COVID-19 |
Regarding the impact of the COVID-19 pandemic, we remain cautious about the global recovery, which we expect to be slow and protracted. In 2020, we experienced solid demand for our cloud-based supply chain and omnichannel commerce solutions, and our competitive win rates remain strong. We had no notable cancellations in 2020.
We have taken steps to best protect the health and safety of our employees globally. Our daily execution has evolved largely into a virtual model, but we believe we have been successful in maintaining our ability to effectively communicate with and service our customers and customer prospects during the pandemic period.
In April 2020, we took proactive actions to manage operating expenses and cash flow, including reduction of officer salaries and board of directors’ fees, suspension of our 401(k) plan company match, and suspension of our share repurchase program. Those actions did not materially impact our ability to support our customers or make key investments in research and development to further extend our competitive positioning. We continue to monitor and aggressively manage operating expenses globally. We also will continue to actively monitor the situation and may take further actions that modify our business operations as may be required by federal, state or local authorities or that we determine are in the best interests of our employees, customers, and partners.
CORPORATE GOVERNANCE HIGHLIGHTS |
Governance Matter | Summary Highlights | |
Board Independence |
| Independent Board of Directors, except Chief Executive Officer |
|
| Fully independent Board committees |
|
| Separate Chairman and Chief Executive Officer roles |
Director Elections |
| Majority Vote Resignation Policy |
Meeting Attendance |
| All Directors attended 100% of total number of Meetings of Board and Committees on which the Directors served in |
Evaluating and Improving Board |
| Commitment to Board Refreshment |
Performance |
| Major Board assessments every three years |
|
| Annual self-assessments of Committees |
Aligning Director and Shareholder |
| Non-executive Director minimum share ownership guidelines |
Interests |
| Annual Director equity awards |
Aligning Executive Officer and |
| Executive officer minimum share ownership guidelines |
Shareholder Interests |
| Executive compensation driven by pay-for-performance philosophy |
Other |
| Annual shareholder advisory ("say-on-pay") vote |
|
| Regular Board review of enterprise risk areas |
|
| Director Status Change Resignation Policy |
|
| Prohibition on pledging and hedging of Company securities |
8 5
Base Salaries
| ✓ |
|
| ✓ |
|
|
|
Annual Cash Bonus
| ✓ | Our annual cash bonus program was based on three performance measures: Target Revenue, new annual contract value from cloud-based services (NACV) and adjusted operating income (AOI), all as defined on page 33. Based on our |
Long-term Incentive Compensation
| ✓ | Our 2020 long-term equity grants to our NEOs were 50% service-based RSUs and 50% performance-based RSUs with three performance measures: Target Revenue, NACV, and AOI. Based on our |
|
|
|
|
|
|
|
CEO Target Versus Realizable Compensation
The “Target” bars represent Mr. Capel’s base salary, target annual cash bonus, and grant-date target value of long-term incentive awards for 2015, 2016, and 2017. The “Realizable” bars represent, as a percentage of target, the total of each year’s base salary paid, annual cash bonus earned and long-term incentive award value as of December 31, 2017. 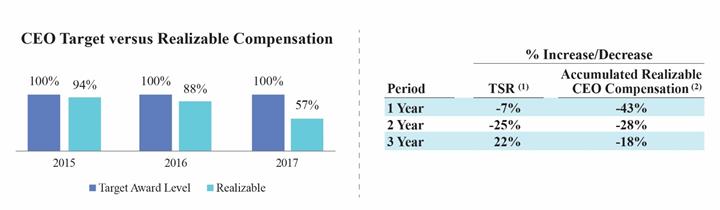
|
|
|
|
Mr. Capel’s accumulated compensation for the past three years had an intended grant-date value of approximately $12.7 million. Based on the Company’s stock price at December 31, 2017 and the Company’s performance for the past three years, the realizable value of this compensation was approximately $10.4 million, which was 18% below their intended target value. By design, our executive compensation program will not deliver the intended target value unless the Company meets or exceeds its applicable financial performance targets.
6
Named Executive Officer Compensation
The following table sets forth the total compensation paid or earned by the Company’s named executive officersNEOs in 20172020 as determined under SEC rules. For more details, please see Compensation Discussion and Analysis starting on page 2426 and the 20172020 Summary Compensation Table and its accompanying notes on page 35.39.
Name and Principal Position | Salary | Stock Awards |
| Non-Equity Incentive Plan Compensation |
| All Other Compensation | Total | Salary | Stock Awards |
| Non-Equity Incentive Plan Compensation |
| All Other Compensation | Total |
|
|
|
|
|
|
|
|
|
|
|
|
|
|
|
Eddie Capel | $575,000 | $2,430,742 |
| $281,750 |
| $43,845 | $3,331,337 | $503,750 | $5,295,282 |
| $669,600 |
| $45,410 | $6,514,042 |
President, Chief Executive |
|
|
|
|
|
|
|
|
|
|
|
|
|
|
Officer, and Director |
|
|
|
|
|
|
|
|
|
|
|
|
|
|
Dennis B. Story | 391,167 | 875,085 |
| 140,140 |
| 21,856 | 1,428,248 | 380,738 | 1,613,868 |
| 345,600 |
| 30,822 | 2,371,028 |
Executive Vice President, Chief |
|
|
|
|
|
|
|
|
|
|
|
|
|
|
Financial Officer, and Treasurer |
|
|
|
|
|
|
|
|
|
|
|
|
|
|
Bruce S. Richards | 309,167 | 437,568 |
| 87,710 |
| 18,826 | 853,271 | 338,000 | 585,056 |
| 211,680 |
| 28,808 | 1,163,544 |
Senior Vice President, Chief |
|
|
|
|
|
|
|
|
|
|
|
|
|
|
Legal Officer, and Secretary |
|
|
|
|
|
|
|
|
|
|
|
|
|
|
Robert G. Howell | 308,250 | 875,085 |
| 147,000 |
| 30,902 | 1,361,237 | 344,000 | 1,260,832 |
| 367,200 |
| 30,366 | 2,002,398 |
Senior Vice President, |
|
|
|
|
|
|
|
|
|
|
|
|
|
|
Americas Sales |
|
|
|
|
|
|
|
|
|
|
|
|
|
|
Linda C. Pinne | 245,750 | 121,553 |
| 40,261 |
| 8,100 | 415,664 | 263,345 | 211,822 |
| 99,544 |
| 3,819 | 578,530 |
Senior Vice President, Global Corporate |
|
|
|
|
|
|
|
|
|
|
|
|
|
|
Controller, and Chief Accounting Officer |
|
|
|
|
|
|
|
|
|
|
|
|
|
|
|
|
|
|
|
|
|
|
|
|
|
|
|
|
|
79
Components of Target Compensation for 20172020
Our executives’ target compensation for 20172020 consisted of the components described below.below (1).
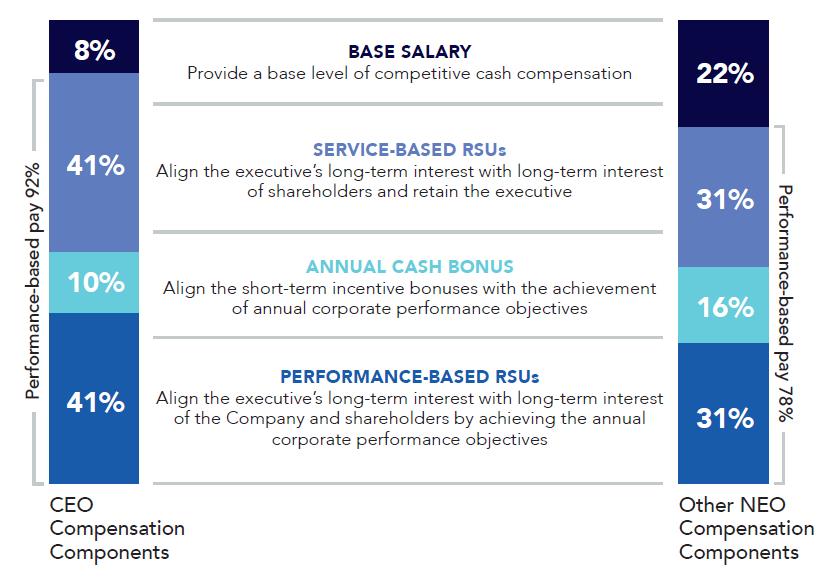
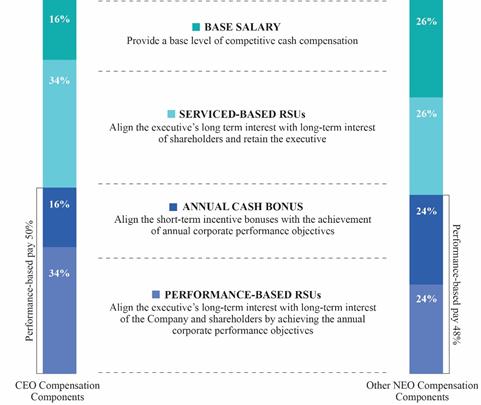
| (1) | The above chart includes base salary earned in 2020, target short-term incentive opportunities, and the grant date value of annual equity awards. |
With approximately 50%80% of performance-based pay, we believe our current executive compensation program directly links executive compensation to our financial performance and alignaligns the interests of our executive officers with those of our shareholders. We believe our executive compensation programs provide our executive officers with a balanced compensation package that includes a reasonable base salary along with annual and long-term incentive compensation opportunities based on our performance against pre-established financial performance objectives. This strong alignment between our financial results, shareholder returns, and executive compensation is the cornerstone of our executive compensation philosophy and program design. See page 2831 for more information.
810

2300 Windy Ridge Parkway, Tenth Floor
Atlanta, Georgia 30339
Annual Meeting of Shareholders
May 17, 201813, 2021
Information Concerning Solicitation and Voting
annual meeting of Shareholders |
This Proxy Statement (“Proxy Statement”) is furnished on behalf of the Board of Directors (the “Board”) of Manhattan Associates, Inc., a Georgia corporation (the “Company,” “our,” “we” or “us”), to solicit proxies for use at the Annual Meeting of Shareholders to be held on Thursday, May 17, 2018,13, 2021, at 9:00 a.m., Atlanta, Georgia,Eastern time (the “Annual Meeting”), or at any adjournment or postponement of the meeting, for the purposes set forth in this statement and in the accompanying Notice of Annual Meeting. The Annual Meeting will be held at 2300 Windy Ridge Parkway, Atlanta, Georgia 30339.
We intend to hold the Annual Meeting in person, but we continue to monitor developments regarding the COVID-19 pandemic. Accordingly, it could become necessary to change the date, time, location or means of holding the meeting. If we determine that it is not possible or advisable to hold our Annual Meeting as currently planned, we will announce our change of plan in a press release, post the details on our website, and file the details with the SEC as proxy materials. If you plan to attend our Annual Meeting, please check our website the week of the meeting. As always, we encourage you to vote your shares prior to the meeting.
Internet Availability of Proxy Materials
The Company is following the Securities and Exchange Commission (the “SEC”) “Notice and Access” rule that allows companies to furnish their proxy materials over the Internet. As a result, instead of mailing a paper copy of the proxy materials, which include this Proxy Statement, proxy card, and our Annual Report on Form 10-K for the fiscal year ended December 31, 20172020 (the “2017“2020 Annual Report”), the Company intendswe intend to mail, beginning on April 4, 2018,March 31, 2021, a notice to our shareholders (the “Notice”) notifying them that those materials are available on the Internet beginning April 4, 2018,March 31, 2021, how our shareholders may access them over the Internet, and how to request a paper or email copy. There is no charge for requesting a paper or email copy.
Registered and beneficial shareholders may view and print this Proxy Statement and the 20172020 Annual Report at www.proxyvote.com or in the Investor Relations section of our web site at www.manh.com.
How to Vote
The Notice contains instructions on how to vote online, by mail (if you request a paper copy of proxy materials), or in person. You may also vote by calling 1-800-690-6903 or the number on the proxy card. You will need the control number from your proxy card or the Notice.
Shareholders Entitled to Vote
Only holders of record of the Company’s common stock, $0.01 par value per share (“Common Stock”), at the close of business on March 21, 201819, 2021 (the “Record Date”) will be entitled to notice of and to vote at the Annual Meeting. At the close of business on the Record Date, the Company had 66,819,43163,616,713 shares of Common Stock outstanding and entitled to.to vote. Each holder of record of Common Stock on that date will be entitled to one vote for each share held on all matters to be voted on at the Annual Meeting.
911
Proposal 1 – Election of Class II Directors
The Board of Directors has seven members divided into three classes. The term of each Director is three years, and the terms of the Directors are staggered by class. The Board currently comprises two Class I Directors (Messrs. Capel and Moran), whose terms expire in 2020, two2023, three Class II Directors (Messrs. Raghavan and Eger)Eger, and Ms. Hollembaek), whose terms expire at the Annual Meeting, and threetwo Class III Directors (Messrs. Huntz Heyman, and Noonan), whose terms expire in 2019.2022. On the Nomination and Governance Committee’s recommendation, the Board has nominated Messrs. Raghavan and Eger, and Ms. Hollembaek, for re-election as Class II Directors, and Linda T. Hollembaek for election as a new Class II Director. Onwhich will become effective at the election of the three Class II Director nominees, the Board’s size will increase to eight members.Annual Meeting. There are no family relationships among our Directors or Director nominees.
Shares represented by executed proxies will be voted for the election of the nominees named below, unless the authority to do so is withheld. If any nominee unexpectedly becomes unavailable for election, the individuals acting as proxies may exercise their discretion to vote for the election of the Board’s substitute nominee. The individuals nominated for election at the Annual Meeting have agreed to serve if elected, and the Board has no reason to believe that they will be unable to serve.
✓ | THE BOARD OF DIRECTORS UNANIMOUSLY RECOMMENDS A VOTE “FOR” THE NAMED NOMINEES. |
Board of Directors and Committees
director Nominees
Set forth below are our nominees to serve as Class II Directors (terms expire in 2021)2024).
Deepak Raghavan
Primary Occupation | Age | Director Since | Current Term Expires | Board Committees | Other Public Company Boards | Director Qualification Highlights | Age | Director Since | Current Term Expires | Board Committees | Other Public Company Boards | Director Qualification Highlights |
Adjunct Professor at Georgia State University | 51 | 1998 | 2018 | ✓Nomination & Governance (Chair) | None | ✓Business operations ✓Business development and corporate transformation ✓Corporate governance ✓Supply chain management ✓Technology and software industries | ||||||
Lecturer and Adjunct Professor at Georgia State University | 54 | 1998 | 2021 | ✓Nomination & Governance (Chair) | None | ✓Business operations ✓Business development and corporate transformation ✓Corporate governance ✓Supply chain management ✓Technology and software industries | ||||||
Biography
Deepak Raghavan, age 51,54, a co-founder of the Company, has served as a member of our Board since February 1998. Dr. Raghavan conceptualized, designed and developed the Company’s PkMS® solution—the industry's first "packaged" supply chain execution system. Dr. Raghavan served as our Senior Vice President - President—Product Strategy from January 2001 until June 2002, as Senior Vice President and Chief Technology Officer from August 1998 until January 2001, and as Chief Technology Officer from our inception in October 1990 until August 1998. From 1987 until 1990, Dr. Raghavan served as a Senior Software Engineer for Infosys Technologies Limited, a software development company, where he specialized in the design and implementation of information systems for the apparel manufacturing industry. Dr. Raghavan earned a Civil Engineering degree from the Indian Institute of Technology, New Delhi, in 1987, an executive MBA degree from Georgia State University in 1998, and a Ph. D. degree in Astronomy from Georgia State University in 2009, and2009. He is currently anlecturer and adjunct professor at Georgia State University.
Experience, Skills and Qualifications of Particular Relevance to Manhattan Associates
Dr. Raghavan has been an officer of the Company or member of our Board since its inception, and during that time has helped guide the Company through its transformation from a small private software and services company to a growing public company. With over 20approximately 30 years of experience with the Company, Dr. Raghavan brings deep institutional knowledge and perspective to our Board regardingabout our strengths, challenges, and opportunities, as well as significant industry experience. As chairman of our Nominations and Governance Committee, Dr. Raghavan’s principled leadership is reflected in numerous
1012
committee achievements, including recommending, and then establishing, a process for regular Board meeting presentations and discussions on material company risk areas; adoption of our Majority Voting Director Resignation Policy; adoption of our Director Status Change Resignation Policy; and championing the committee’s recent Board recruiting efforts yielding our first female Board nominee. Dr. Raghavan’s skills and perspectives also have best positioned him to oversee new Director onboarding and other Board transitions.
Edmond I. Eger III
Primary Occupation | Age | Director Since | Current Term Expires | Board Committees | Other Public Company Boards | Director Qualification Highlights | Age | Director Since | Current Term Expires | Board Committees | Other Public Company Boards | Director Qualification Highlights |
CEO of Rewards Network Establishment Services, Inc. | 57 | 2015 | 2018 | ✓Compensation | None | ✓Business operations ✓Corporate governance ✓International operations ✓Leadership - current CEO ✓Financial industries | 60 | 2015 | 2021 | ✓Audit | None | ✓Business operations ✓Corporate governance ✓International operations ✓Leadership - current CEO ✓Financial industries |
Biography
Edmond I. Eger III, age 57,60, has served as a member of our Board since October 2015. Since September 2017, Mr. Eger has served as the Chief Executive Officer and member of the Board of Directors of Rewards Network Establishment Services, Inc., which helps restaurants increase their revenue, traffic, and customer engagement through their innovative financial and marketing services. From December 2013 through January 2017, Mr. Eger served as the President and Chief Executive Officer of OANDA Corporation, a leader in online foreign exchange and over-the-counter commodities and indices trading services. From 2009 to 2013, he served as a Senior Vice President and General Manager for the Americas at PayPal, Inc., and as an advisor to the CEO at eBay Corporation. From 1999 to 2009, Mr. Eger held various management positions with Citigroup and last served as the CEO for its International Cards Business. Prior to joining Citigroup, his experience included various business management positions with Advanta, Standard Chartered Bank, Wells Fargo, and McKinsey & Company. From September 2013 to February 2015, he served on the Board of Directors at Digital River, Inc., a Nasdaq traded e-commerce and payment provider, which was sold to Siris Capital.
Experience, Skills and Qualifications of Particular Relevance to Manhattan Associates
Mr. Eger is a leader in the payments and consumer transactions sectors, with over 25 years ofwide-ranging experience, and has extensive knowledge of international business. He is a seasoned international payments executive with deep financial services, management, branding, and risk management experience. We believe Mr. Eger’s extensive knowledge and leadership experience bringsbring valuable perspective to the BoardBoard. Mr. Eger’s familiarity and the Compensationexperience with audit committee and finance matters at public companies qualify him to continue service on our Audit Committee.
|
|
|
|
|
|
|
|
|
|
|
|
|
|
Primary Occupation | Age | Director Since | Current Term Expires | Board Committees | Other Public Company Boards | Director Qualification Highlights |
Senior Vice President, Integration Management Officer of Lexmark International, Inc. (Retired) | 63 | 2018 | 2021 | ✓Nomination & Governance | None | ✓Business operations ✓Corporate transformation ✓International operations ✓Leadership - former senior executive ✓Supply chain management |
Biography
Linda T. Hollembaek, age 60, recently63, has served as a member of our Board since May 2018. Ms. Hollembaek retired as Senior Vice President, Integration Management Officer of Lexmark International, Inc., a multifaceted technology company that delivers innovative imaging solutions and services to business and consumers worldwide. Ms. Hollembaek served in that role from 2016 until 2017. From 1999 to 2016, Ms. Hollembaek served in other management positions with Lexmark, including Vice President, Global Supply Chain Operations, and Vice President, General Manager of World Wide Services Operations. From 1996 to 1999, she served as Vice President, Sales & Operations, North America, at Danka Services International, one of the world’s largest independent suppliers of office imaging equipment and related services, parts, and supplies. From 1980 to 1996,
13
she held various management positions with Eastman Kodak Company and last served as Vice President, Sales and Operations, North America.
11
Experience, Skills and Qualifications of Particular Relevance to Manhattan Associates
Ms. Hollembaek brings expertise to the Board on supply chain management, corporate transformation, international operations, and Asia-Pacific markets. We believe her knowledge and leadership experience in these areas will enable her to contribute significant value to our Board.
Continuing Directors
The members of our Board continuing in office as Class I Directors, elected to serve until the 20202023 Annual Meeting of Shareholders, are as follows:
Primary Occupation | Age | Director Since | Current Term Expires | Board Committees | Other Public Company Boards | Director Qualification Highlights | Age | Director Since | Current Term Expires | Board Committees | Other Public Company Boards | Director Qualification Highlights |
President and CEO of Manhattan Associates, Inc. | 57 | 2012 | 2020 | None | None | ✓Business operations ✓Business development and corporate transactions ✓Insider’s knowledge of day-to-day operation of the Company ✓Leadership - current CEO ✓Supply chain management ✓Technology and software industries | 60 | 2012 | 2023 | None | ✓Skyline Champion Corporation | ✓Business operations ✓Business development and corporate transactions ✓Insider's knowledge of day-to-day operations of the Company ✓Leadership - current CEO ✓Supply chain management ✓Technology and software industries |
Biography
Eddie Capel, age 5760, has served as our President and Chief Executive Officer since January 1, 2013. Prior to that, beginning in July 2012, Mr. Capel served as our President and Chief Operating Officer. Also, in July 2012, the Board elected Mr. Capel to the Board as a Class I director. Prior to becoming our President, Mr. Capel served as Executive Vice President and Chief Operating Officer since January 12, 2011. Previously, Mr. Capel served as our Executive Vice President—Global Operations from January 2009 to January 2011. In this capacity, Mr. Capel was responsible for the Company’s global product management, research and development, and customer support functions. From January 2008 through January 2009, Mr. Capel served as our Executive Vice President—Global Product Management and Customer Services. From January 2005 to January 2007, Mr. Capel served as our Senior Vice President—Global Product Management and Global Customer Services and from January 2004 through January 2005 as our Senior Vice President Product Management. Prior to January 2004, he held various other positions with the Company. Prior to joining Manhattan Associates in June 2000, Mr. Capel held various positions at Real Time Solutions, including chief operations officer and vice president, operations. He also served as director, operations, with Unarco Automation, an industrial automation/robotics systems integrator. Prior to joining Unarco, Mr. Capel worked as a project manager and system designer for ABB Robotics in the United Kingdom. Mr. Capel also serves on the Board of Skyline Champion Corporation (NYSE: SKY).
Experience, Skills and Qualifications of Particular Relevance to Manhattan Associates
As our President and Chief Executive Officer, Mr. Capel’s insider and industry perspectives, and knowledge of the Company’s day-to-day operations, enable him to work with the Board and provide essential leadership in strategy development and implementation, allocation of company resources, and communication with the Company’s various stakeholders and audiences.
14
Charles E. Moran
Primary Occupation | Age | Director Since | Current Term Expires | Board Committees | Other Public Company Boards | Director Qualification Highlights | Age | Director Since | Current Term Expires | Board Committees | Other Public Company Boards | Director Qualification Highlights |
Chairman and CEO of Skillsoft Corporation (Retired) | 63 | 2017 | ✓Nomination & Governance | None | ✓Accounting and finance ✓Business strategy and operations ✓Corporate governance ✓Leadership - former CEO ✓Technology and software industries | 66 | 2017 | 2023 | ✓Compensation | ✓Commvault Systems, Inc. ✓Duck Creek Technologies, Inc. | ✓Accounting and finance ✓Business strategy and operations ✓Corporate governance ✓Leadership - former CEO ✓Technology and software industries | |
Biography
Charles E. Moran, age 63,66, has served as a member of our Board since May 2017. Mr. Moran retired as the Chairman and Chief Executive Officer of Skillsoft Corporation, a leading global provider of cloud-based learning and talent management solutions.
12
Mr. Moran held those positions from 1998 to 2015 and remained on as the Chairman from 2015 to 2016. From 1995 to 1997, Mr. Moran served as the President and Chief Executive Officer of NETg, a subsidiary of National Education Corporation, and a provider of computer-based training for IT professionals. From 1993 to 1994, he served as the Chief Operating Officer and Chief Financial Officer of SoftDesk, a leading Architecture, Engineering and Construction/Computer-Aided Design software application company, which was acquired by Autodesk. From 1992 to 1993, he served as the President of Sytron Corp, a data management software subsidiary of Rexon, Inc. From 1989 to 1992, he was Vice President of Sales and Marketing at Insite Peripherals, a manufacturer of floppy disk drives. Prior to joining Insite Peripherals, his experience included various business management positions with Archive Corporation, Florida Data, and Hamilton-Avnet Corporation. From 2009 to 2014, Mr. Moran served on the Board of Directors at Higher One, Inc., a leading payment technology provider for higher education. From 1997 to 2001, he served on the Board of Directors at Workgroup Technology, a client/server product data management solution. Mr. Moran also serves on the Boards of Commvault Systems, Inc. (NASDAQ: CVLT) and Duck Creek Technologies, Inc. (NASDAQ: DCT).
Experience, Skills and Qualifications of Particular Relevance to Manhattan Associates
Mr. Moran brings expertise to the Board on digital transformation, cloud and SaaS business models, and cybersecurity. A well-rounded executive, Mr. Moran grew up in sales, proved his financial acumen through his time as a Chief Financial Officer, and is recognized as an outstanding strategist and operator. We believe Mr. Moran’s extensive background and knowledge in technology and consulting, and his leadership experience as a corporate executive, make him well-suited to continue to add value to the Company’s Board.
The members of our Board continuing in office as Class III Directors, elected to serve until the 20192022 Annual Meeting of Shareholders, are as follows:
John J. Huntz, Jr.
Primary Occupation | Age | Director Since | Current Term Expires | Board Committees | Other Public Company Boards | Director Qualification Highlights | Age | Director Since | Current Term Expires | Board Committees | Other Public Company Boards | Director Qualification Highlights |
Managing Director of Huntz & Co., LLC | 67 | 1999 | 2018 | ✓Audit (Chair) ✓Compensation ✓Nomination & Governance | None | ✓Accounting and finance ✓Business development and corporate transactions ✓Business operations ✓Corporate governance ✓Leadership - current Chairman | 70 | 1999 | 2022 | ✓Audit (Chair) ✓Compensation ✓Nomination & Governance | None | ✓Accounting and finance ✓Business development and corporate transactions ✓Business operations ✓Corporate governance ✓Leadership - current Chairman |
Biography
John J. Huntz, Jr., age 67,70, has served as a member of our Board since January 1999 and as Chairman of our Board since May 2003. Mr. Huntz has more than 3035 years of private equity, venture capital, and operational experience. Since 2013, Mr. Huntz has served as Managing Director of Huntz & Co., LLC, a venture advisory firm. He also serves on several early stage technology and healthcare venturesventure boards and is an Advisor to Balentine, an Atlanta based wealth management firm. From 2005 to 2013, Mr. Huntz served as Executive Director, Venture Capital Investments, of Arcapita, Inc., and from 2009 to 2013, served as its President. From 2006 until 2010, Mr. Huntz also served as a director and Chairman of the Audit Committee of CardioMEMS, Inc., and then until 2014, he served as its Chairman of the Board. CardioMEMS was acquired by St. Jude Medical in 2014. From
15
1994 through 2005, Mr. Huntz worked at the Fuqua Companies, most recently as Managing Director of Fuqua Ventures. Mr. Huntz also served as Executive Vice President and Chief Operating Officer of Fuqua Enterprises, Inc., (NYSE) a public company.
Mr. Huntz’ prior experience includes, from September 1989 to January 1994, serving as Managing Partner of Noble Ventures International, a private equity firm. From 1984 to 1989, Mr. Huntz provided financial and investment management consulting as Director of Capital Resources for Arthur Young & Company, and from 1979 to 1984, he was an investment professional at Harrison Capital, a private equity investment subsidiary of Texaco. Mr. Huntz has also served as a Board member for the National Venture Capital Association, and the SEC’s Small Business Capital Formation Task Force Executive Committee. He founded and leadsis chairman of the Southern Capital Forum, and is an Advisory Board member of the Metro Atlanta Chamber of Commerce, past Chairman of the Georgia Logistics Innovation Council, andis a member of the Board of Georgia Advanced Technology Ventures (Georgia Tech). He also, is on the Piedmont Hospital Foundation Board, and has served in numerous other business and community organizations. Mr. Huntz also is a board member of privately held businesses Bastille Networks (internet security) and Launch Media Networks (fan focused media).
Experience, Skills and Qualifications of Particular Relevance to Manhattan Associates
Mr. Huntz has over 3040 years of both private and public company operating and leadership experience and has served on numerous boards. In addition, he has extensive financial industry experience through his private equity and venture capital work. We believe Mr. Huntz’s extensive experience, his operational, leadership and finance expertise, and his business and community
13
prominence make him well suited to be our Chairman of the Board and our Audit Committee Chairman. Our Board has determined Mr. Huntz is an “audit committee financial expert” as defined in SEC rules.
Thomas E. Noonan
Primary Occupation | Age | Director Since | Current Term Expires | Board Committees | Other Public Company Boards | Director Qualification Highlights | Age | Director Since | Current Term Expires | Board Committees | Other Public Company Boards | Director Qualification Highlights |
Partner of TechOperators, LLC and Chairman of TEN Holdings, LLC | 57 | 1999 | 2019 | ✓Audit ✓Compensation (Chair) | ✓International Exchange, Inc. | ✓Accounting and finance ✓Business operations ✓Corporate governance ✓Leadership - current Partner ✓Technology and software industries | ||||||
General Partner of TechOperators, LLC | 60 | 1999 | 2022 | ✓Audit ✓Compensation (Chair) | ✓Intercontinental Exchange, Inc. | ✓Accounting and finance ✓Business operations ✓Corporate governance ✓Leadership - current Partner ✓Technology and software industries | ||||||
Biography
Thomas E. Noonan, age 57,60, has served as a member of our Board since January 1999. Since 2008, Mr. Noonan has served as a Partner of TechOperators, LLC, an early stage technology investment firm that he founded. Since 2013, he has served on the Board of Directors of Ionic Security Inc., a data security company funded by TechOperators. Mr. Noonan became Executive Chairman of Ionic Security in January 2016. He is also Chairman of TEN Holdings, LLC, a diversified family office investment company. From July 2013 until November 2015, Mr. Noonan served as Senior Director and General Manager for the EnergyWise product group at Cisco Systems, which in July 2013, had acquired JouleX, a company founded by Mr. Noonan, which was a leading innovator in network-based enterprise management. Since 2010, Mr. Noonan had served as President and Chief Executive Officer of JouleX. Mr. Noonan also co-founded Endgame Security, the leading provider of software solutions to the U.S. Intelligence Community and Department of Defense, where he currently serves on the Board of Directors. From November 2006 until February 2008, Mr. Noonan served as the General Manager of IBM Internet Security Systems, a division of IBM providing information technology system security products and services. Mr. Noonan served as the President and member of the Board of Directors of Internet Security Systems, Inc., since May 1995, and as its Chief Executive Officer and Chairman from November 1996 until its acquisition by IBM in November 2006. Prior to joining Internet Security Systems, Mr. Noonan served as Vice President, Sales and Marketing with TSI International, Inc., an electronic commerce company, from October 1994 until April 1995. From November 1989 until October 1994, Mr. Noonan held high-level sales and marketing positions at Dun & Bradstreet Software, a developer of enterprise business software. Mr. Noonan also serves on the boards of Intercontinental Exchange, Inc. (NYSE: ICE), Children’s Healthcare of Atlanta, and the Georgia Tech Foundation, and isFoundation. He served on the National Infrastructure Advisory Council.Council from 2002 through 2019.
Experience, Skills and Qualifications of Particular Relevance to Manhattan Associates
Mr. Noonan brings to the Company many years of experience in senior management in the software industry, including as co-founder, Chairman, President, and Chief Executive Officer of a public software company. We believe his entrepreneurial, executive management, and software industry experience is an indispensable resource to the Board. His executive experiences, in which he has dealt with public company compensation plan design and implementation, qualify him well to continue to chair our Compensation Committee. Mr. NoonanNoonan’s familiarity and experience with corporate accounting and finance matters withinat public companies qualify him to continue service on our Audit Committee. Our Board has determined he is an “audit committee financial expert” as defined in SEC rules.
John H. Heyman
Primary Occupation | Age | Director Since | Current Term Expires | Board Committees | Other Public Company Boards | Director Qualification Highlights |
CEO of SnapAV and Partner of Actuate Partners, LLC | 56 | 2016 | 2019 | ✓Audit | None | ✓Accounting and finance ✓Business operations ✓Corporate governance ✓Leadership - current CEO ✓Technology and software industries |
Biography
John H. Heyman, age 56, has served as a member of our Board since May 2016. Mr. Heyman is Chief Executive Officer of SnapAV, a vertically-integrated distributor of audio-visual products for commercial and home use, and has held that position since January 2015. Since 2011, Mr. Heyman has been a partner of Actuate Partners, LLC, a firm which he co-founded in 2011,
1416
and which provides equity funding and consulting to companies in the technology industry, including software, SaaS, and tech-enabled services. Since 2012, he has served on the Board of Influence Health, Inc., which provides software and services to healthcare marketers and clinicians, and served as its executive chair from 2013-2014. From 1995 to 2011, Mr. Heyman was an executive with Radiant Systems, Inc., a leading provider of software, hardware, and consulting services to the retail and hospitality industries. During that period, he was CEO from 2003 to 2011, when the company was sold, and CFO from 1995 to 2002. Earlier in his career, Mr. Heyman served as a public accountant with accounting firm Arthur Andersen, having received his CPA certification in 1985.
Experience, Skills and Qualifications of Particular Relevance to Manhattan Associates
Mr. Heyman has over 20 years of experience in senior and executive management of software enterprises, including under traditional licensing models and cloud-based and other recurring revenue models. While CEO of Radiant Systems, he oversaw the significant growth of Radiant through expansion into new markets and geographies, launching numerous new products, and acquisitions of over 15 companies, both domestic and international. We believe Mr. Heyman’s broad background in technology and consulting, his substantial experience in development and distribution of software and consulting services for the retail industry, and his leadership success as a corporate executive, make him well-suited to add value to the Company’s Board. Mr. Heyman’s public accounting background and his experiences dealing with accounting and finance matters as a public company CEO qualify him well to continue service on our Audit Committee. Our Board has determined Mr. Heyman is an “audit committee financial expert” as defined in SEC rules.
Majority Vote Resignation Policy for Director Elections
The Company’s Bylaws provide that Directors are elected by a plurality of the votes cast. Although nominees who receive the most votes for the available positions will be duly elected, the Board has adopted a Majority Voting Director Resignation Policy (the “Resignation Policy”) applicable to nominees who fail to receive the affirmative vote of a majority of the votes cast in an uncontested election for Directors. The Resignation Policy requires that a nominee not receiving a majority affirmative vote in an uncontested election promptly tender to the Board or its Chair their resignation from the Board and committees on which that Director serves. The resignation may be conditioned upon Board acceptance. If it is not so conditioned, the resignation must specify that it is effective immediately on delivery.
A “majority affirmative vote” means that the votes cast “for” a nominee’s election exceed those “against,” with abstentions and broker non-votes not being considered “votes cast.” You have been provided with options to vote “for” or “against” each Director nominee, and also to “abstain” from voting on a particular nominee. However, neither a vote “against” a Director nominee, nor an abstention, affects whether a Director nominee in an uncontested election is legally elected under the plurality vote standard (provided such nominee receives at least one “for” vote). But a vote “against” a Director is considered in determining whether a Director who is elected has received a “majority affirmative vote” for purposes of the Resignation Policy (as noted above, an abstention does not affect the Resignation Policy-related determination).
If a Director nominee elected to the Board fails to receive a majority affirmative vote and tenders a conditional resignation to the Board, the Nomination and Governance Committee of the Board will consider their resignation, including any information provided by that Director, and within 60 days of the shareholder meeting at which that Director failed to receive a majority affirmative vote, will recommend to the full Board what action to take on the Director’s resignation. The Committee may recommend, among other things, acceptance or rejection of the resignation, delayed acceptance pending the recruitment and election of a new Director, or rejection of the resignation in order to address the underlying reasons for the Director’s failure to receive the majority affirmative vote of the shareholders. The policy provides for the Board to act on the Committee’s recommendation within 90 days following the shareholder meeting.
In considering a conditional resignation, the Committee and the Board may consider those factors they deem relevant, including but not limited to the underlying reasons for the failure of the Director to receive a majority affirmative vote, the tenure and qualifications of the Director, the Director’s past and expected future contributions, other policies, and the overall composition of the Board, including whether accepting the resignation would cause the Company to fail to meet legal or stock market requirements.
Following the Board’s decision, the Company will publicly announce the Board’s decision regarding any conditional resignation. A resigning Director cannot participate in Committee or Board decisions regarding their resignations, except in certain cases where multiple Directors have failed to receive majority affirmative votes, which circumstances are described in the full policy posted in the Investor Relations section of our web site at www.manh.com. The preceding summary of the policy is qualified in its entirety by reference to the full policy.
15
Board Independence and Meetings
The Board currently consists of seven members, all of whom, with the exception of Mr. Capel, our President and Chief Executive Officer, have been determined by the Board to be “independent” as that term is defined under the corporate governance rules of The Nasdaq Stock Market. In assessing the independence status of Mr. Raghavan, who was a co-founder of Manhattan, the Board considered the following as factors in support of his independence: Mr. Raghavan has had no operating involvement with the Company since he retired as an officer and employee in 2002, which far exceeds the three-year post-employment look-back period under the Nasdaq rules; none of the executives with whom he served prior to his retirement as an officer remains with the Company; he is not a party to any related party transactions; and he has not retained a substantial share of ownership of Manhattan—his financial orientation vis-à-vis Manhattan is comparable to Manhattan’s other non-employee directors from the standpoint of independence and governance risk—each of Manhattan’s non-employee directors owns less than one-fourth of one percent of Manhattan’s outstanding equity (on a diluted basis), and Mr. Raghavan owns less than one-tenth of one percent of Manhattan’s outstanding equity (on a diluted basis).
In compliance with Nasdaq corporate governance rules, the independent Directors of the Company conduct regularly scheduled meetings without the presence of non-independent Directors or management. The Board’s standing independent committees also regularly meet without management present. During the fiscal year ended December 31, 2017,2020, the Board held fivesix meetings. All the incumbent Directors attended at least 75% of the aggregate total number of Board meetings and meetings of Committees on which they served that occurred during the portion of fiscal year 20172020 during which each served as a Director. Our Directors are invited to the Annual Meeting of Shareholders, and two Directors attended our 20172020 Annual Meeting.
17
The Board maintains three permanent committees: Audit Committee, Compensation Committee, and Nomination and Governance Committee. The Board has adopted charters for the committees, which can be found in the Investor Relations section of our web site at www.manh.com.
The following table provides membership including independencyindependence and meeting information for each committee during 2017.2020.
|
| Committee Memberships |
| Committee Memberships | ||||
Name | Independent | Audit | Compensation | Nomination & Governance | Independent | Audit | Compensation | Nomination & Governance |
Eddie Capel | No |
| No |
| ||||
Edmond I. Eger III | Yes | ✓ | Yes | ü |
|
| ||
John H. Heyman | Yes | ✓ | ||||||
Linda T. Hollembaek | Yes |
|
| ü | ||||
John J. Huntz, Jr. | Yes | Chair | ✓ | Yes | Chair | ü | ||
Charles E. Moran | Yes |
| ✓ | Yes |
| ü |
| |
Thomas E. Noonan | Yes | ✓ | Chair |
| Yes | ü | Chair |
|
Deepak Raghavan | Yes |
|
| Chair | Yes |
| Chair | |
2017 Meetings |
| 4 | 6 | 4 | ||||
2020 Meetings |
| 4 | 6 | 5 | ||||
Audit Committee
During 2017,2020, the Audit Committee consisted of Messrs. Huntz, Heyman,Eger and Noonan. Mr. Huntz serves as Chairman of the Audit Committee. The Board has determined that each member of the Audit Committee meets the additional Nasdaq independence and financial literacy requirements for Audit Committee members, as well as the SEC’s Audit Committee independence standards. Further, the Board has determined that Messrs. Huntz Heyman, and Noonan are “audit committee financial experts,” as defined by SEC rules. Among other responsibilities, the Audit Committee recommends to the Board the selection of our independent registered public accounting firm, reviews the scope and results of the audit, reviews with management our internal controls and periodic financial statements, and approves of the inclusion of our audited financial statements in our Annual Report on Form 10-K to be filed with the SEC. The Audit Committee also reviews and discusses with management and our auditors major financial risk exposures and those steps management has taken to monitor and control those exposures. During the fiscal year ended December 31, 2017,2020, the Audit Committee met four times.
Compensation Committee
During 2017,2020, the Compensation Committee consisted of Messrs. Noonan, Eger,Huntz, and Huntz.Moran. Mr. Noonan serves as Chairman of the Compensation Committee. The Board has determined that each member of the Compensation Committee meets the additional Nasdaq independence requirements for members of compensation committees. The Compensation Committee approves the compensation of our executive officers, including the Chief Executive Officer, reviews compensation plans for our non-employee Board members, officers, and other key executives, and makes recommendations concerning those matters to the Board. The Compensation Committee also administers our equity incentive programs and establishes the terms of our grantedgrants under these plans. During the fiscal year ended December 31, 2017,2020, the Compensation Committee met six times.
Nomination and Governance Committee
During 2017,2020, the Nomination and Governance Committee (the “Governance Committee”) consisted of Messrs. Raghavan and Huntz, and Moran.Ms. Hollembaek. Mr. Raghavan serves as Chairman of the Governance Committee. The Governance Committee recruits outstanding individuals to serve on our Board and recommends to our Board the slate of Director nominees to stand for election at our annual meetings of our shareholders. The Governance Committee also recommends Directors for appointment to our Board Committees and oversees our
16
periodic formal Board and Committee assessment process, including oversight of post-assessment improvements. During the fiscal year ended December 31, 2017,2020, the Governance Committee met fourfive times.
In accordance with the provisions of our Bylaws, our shareholders may directly nominate prospective Director candidates by delivering notice to our Corporate Secretary containing certain information about the nominee not less than 60 days prior to the meeting as originally scheduled, or if less than 70 days’ notice or prior public disclosure of the date of the scheduled meeting is given or made, delivery of notice to the Company not later than the tenth day following the earlier of the day on which notice of the date of the meeting is mailed to shareholders or public disclosure of the date of that meeting is made. Our Corporate Secretary’s address is Manhattan Associates, Inc., 2300 Windy Ridge Parkway, Tenth Floor, Atlanta, Georgia 30339.
18
Shareholders may also recommend a director candidate for consideration by the Governance Committee by submitting the candidate’s name and qualifications to our Corporate Secretary. The Governance Committee haswill consider any candidate recommended (but not adopted a formal policy with regard to consideration of any Director candidate proposedalso directly nominated) by shareholders for inclusion in the Board’s slate. The Governance Committee believes such a policy is not necessary or appropriate because of our shareholders’ ability to directly nominate Directorslate in the same manner it considers other candidates forin the Board.candidate pool, as described below.
In identifying qualified individuals to become members of the Board, the Governance Committee selects candidates whose attributes it believes would be most beneficial to the Company. The Governance Committee (i) considers factors such as the individual’s experience, integrity, competence, skills, and dedication in the context of the needs of the Board, (ii) seeks to recruit from a diverse pool, considering diversity factors such as gender, race, ethnicity, age, and occupation, and (iii) takes reasonable steps to include meaningful representation in the candidate pool of women and minorities. The Governance Committee generally identifies Director nomineescandidates through thetheir personal, business, and organizational contacts and those of existing Directors and management, but also may use a variety of other sources to identify Director nominees, including third-partythrough search firms, counsel, advisors, and from shareholder recommendations. The composition of our current Board reflects diversity in business and professional experience and skills.
In connection with the nomination of Ms. Hollembaek for election to the Board at our 2018 Annual Meeting, an executive search firm contacted the Company and recommended the Company consider whether Ms. Hollembaek might be a good candidate to serve on the Board. The Company did not pay any fee to JamesDruryPartners in connection with their recommendation of Ms. Hollembaek.
Board Leadership Structure
Our Bylaws allow, but do not require, our Board to appoint an officer or a non-executive to the position of Chairman of our Board. Our Board has chosen to separate the positions of Chairman and Chief Executive Officer. Currently, John J. Huntz, Jr., a non-employee independent Director, serves as Chairman and Eddie Capel serves as our President and Chief Executive Officer. We believe separating these positions allows our Chief Executive Officer to focus more on our day-to-day business and other traditional CEO roles, while allowing the Chairman to lead our Board in its fundamental role of providing advice to and independent oversight of management. Our Board recognizes the time, effort, and energy that the Chief Executive Officer is required to devote to his position in the current business environment, as well as the commitment required to serve as our Chairman, particularly as our Board’s oversight responsibilities continue to grow. Although we do not have a policy mandating the separation of the roles of Chairman and Chief Executive Officer, our Board believes that having separate positions and having an independent outside Director serve as Chairman currently is the appropriate leadership structure for Manhattan Associates.
Code of Ethics |
Our Board has adopted a Global Ethics and Compliance Code that is applicable to all members of our Board, our executive officers, and our employees. The Code appears in the Investor Relations section of our web site at www.manh.com. If, in the future, we amend, modify, or waive a provision in the Code, we may, rather than file a Form 8-K, satisfy the disclosure requirement under Item 5.05 of Form 8-K by posting that information on our web site.
Risk Management |
While we believe risk management is the responsibility of every employee, senior management is ultimately accountable to our Board and shareholders for risk management. Senior management is responsible for the day-to-day management of our risks, while our Board, including through its Committees, oversees planning and responding to risks arising from changing business conditions or the initiation of new activities or products. Our Board also is responsible for overseeing compliance with laws and regulations, responding to recommendations from auditors and supervisory authorities, and overseeing management’s conformance with internal policies and controls addressing the operations and risks of significant activities.
Our Board believes that full and open communication between management and our Board is essential for effective risk management and oversight. Our Board receives regular reports from members of senior management on areas of material risk to the Company,
17
including operational, financial, legal and regulatory, strategic, competitive, and reputational risks. Additionally, senior management is available to address any questions or concerns raised by our Board on risk management-related and any other matters.
While our Board is ultimately responsible for risk oversight at the Company, our three Board Committees assist our Board in fulfilling its oversight responsibilities in certain areas of risk. The Audit Committee assists our Board in fulfilling its oversight responsibilities with respect to risk management in the areas of financial reporting, internal controls, cyber risk, data protection, business ethics and compliance with legal and regulatory requirements, and discusses policies with respect to risk assessment and risk management.corporate compliance. The Governance Committee assists our Board in fulfilling its oversight responsibilities with respect to the management of risks associated with Board organization, membership and structure, succession planning for our Directors, corporate governance, social responsibility, and corporate governance.sustainability. The Compensation Committee assists our Board in fulfilling its oversight responsibilities with respect to the management of risks arising from our compensation policies and programs, and succession planning for our executive officers.officers, and human capital and talent, including workforce diversity and inclusion.
19
In keeping with its responsibilities, the Compensation Committee has evaluated potential risks arising from the Company’s compensation policies and practices for all employees and concluded that any such risks are not reasonably likely to have a material adverse effect on the Company. Among other possible risks, the Compensation Committee considered risks related to the consolidated revenue and adjusted earnings per sharethree components of our 20172020 incentive compensation plans. Those components are Target Revenue (consolidated revenue excluding revenue from cloud-based services, hardware sales and billed travel), new annual contract value from cloud-based services (NACV) and adjusted operating income (AOI) (see complete definitions on page 33). In reaching its conclusion, the Compensation Committee reviewed and considered various factors, including the following:following factors:
| ✓ | Our incentive compensation plans include a short-term annual cash |
| ✓ | Our long-term equity incentives include both performance-based and service-based awards; |
| ✓ | Our short-term annual cash |
| ✓ | Our Compensation Committee reviews and approves performance criteria and related target levels and performance payout amounts for actual results before incentives are paid. |
20
During 2017, eachAt the beginning of 2020, the Company’s non-employee member ofdirector compensation program provided for the Board of Directors receivedfollowing annual cash and equity compensation:
Cash Compensation
|
| Chairman |
| Other Members |
Board |
| $150,000 |
| $50,000 |
Audit |
| 20,000 |
| 10,000 |
Compensation |
| 20,000 |
| 7,500 |
Nomination & Governance |
| 10,000 |
| 5,000 |
We pay the cash compensation in accordance with the Company’s annual compensation program for non-employee directors. In accordance with that program, our non-employee Chairman received an annual cash retainer of $150,000, payable in monthly installments on the first business day of each month. The other non-employee members of our Board each received an annual cash retainer of $50,000 payablecomponent in quarterly installments, on the first business day of each quarter. In additionexcept for all cash compensation payable to those retainers, the Chairman of each of the Audit Committee and the Compensation Committee received an annual cash retainer of $20,000, and the Chairman of the Nomination and Governance Committee receivedBoard, which we pay in monthly installments. Effective April 1, 2020, through December 31, 2020, we reduced the quarterly payments to the non-employee directors by 25% in response to the COVID-19 pandemic.
Equity Compensation
During 2020, the Company granted each non-employee director an annual cash retaineraward of $10,000. Each member$240,000 of a Committee who was not the Committee Chairman received an additional cash retainer for service on that Committee, with those retainers being $10,000, $7,500, and $5,000 for the Audit, Compensation, and Nomination and Governance Committees, respectively. On the date of the 2017 Annual Meeting of Shareholders, each non-employee Director was awarded 3,600 restricted stock units (“RSUs”). That number of RSUs was basedWe granted the awards on a grant value of $168,840. The RSUsMay 13, 2020, and they vest on the earlier of the first anniversary of the grant date of grant or the next Annual Meeting of Shareholders provided thatso long as the Directordirector remains in continuous service on the Board through that vesting date. We determined the number of RSUs granted based on the closing price of the Company’s Common Stock on the date immediately prior to the 2020 Annual Meeting of Shareholders ($69.74 per share on May 13, 2020), resulting in each non-employee director receiving 3,442 RSUs ($240,000 / $69.74 = 3,442). Upon vesting, we will settle each RSU will be settled with one share of Common Stock.
18
The following table sets forth, for the year ended December 31, 2017,2020, the total compensation earned bypaid to our non-employee members of the Board of Directors.directors.
2017 Director Compensation Table | ||||||||||||
2020 Director Compensation Table | 2020 Director Compensation Table | |||||||||||
Name (1) |
| Fees Paid In Cash |
| Stock Awards(2) |
| Total |
| Fees Paid In Cash |
| Stock Awards(2) |
| Total |
John J. Huntz, Jr. |
| $182,500 |
| $168,840 |
| $351,340 |
| $148,281 |
| $240,045 |
| $388,326 |
Thomas E. Noonan |
| 80,000 |
| 168,840 |
| 248,840 |
| 65,000 |
| 240,045 |
| 305,045 |
John H. Heyman |
| 60,000 |
| 168,840 |
| 228,840 | ||||||
Deepak Raghavan |
| 60,000 |
| 168,840 |
| 228,840 |
| 48,750 |
| 240,045 |
| 288,795 |
Edmond I. Eger III |
| 57,500 |
| 168,840 |
| 226,340 |
| 48,750 |
| 240,045 |
| 288,795 |
Charles E. Moran |
| 34,148 | (3) | 168,840 |
| 202,988 |
| 46,719 |
| 240,045 |
| 286,764 |
Brian J. Cassidy (4) |
| 23,867 |
| - |
| 23,867 | ||||||
Linda T. Hollembaek |
| 44,688 |
| 240,045 |
| 284,733 | ||||||
|
|
|
|
|
|
|
|
|
|
|
|
|
|
|
|
|
|
|
|
|
|
|
|
|
|
____________
(1) | Mr. Capel, our employee Director, does not receive any compensation for his service as a member of the Board of Directors. Mr. Capel’s compensation during |
(2) | This column represents the aggregate grant date fair value of the |
|
|
|
|
Our Compensation Committee recommends to the Board our non-employee directors’ compensation for the Board’s determination. Our Compensation Committee periodically has its independent compensation consultant review the compensation structure and levels for our non-employee directors, including by analyzing director compensation at the same peer companies used in evaluating executive compensation. In January 2020, the Board, on the recommendation of the Compensation Committee, and following consultation with the consultants, increased the annual equity award to the non-employee directors from $200,000 in 2019 to $240,000 in 2020. Based on the independent compensation consultant’s analysis, the Board considers the non-employee directors’ compensation to be appropriate and consistent with practices of comparable companies. See “The Role of Compensation Consultant” on page 29 for additional information regarding the Compensation Committee’s independent compensation consultant during 2020
21
The following table summarizes the equity awards made to the non-employee members of our Board that were outstanding and unvested as of December 31, 2017.2020.
Non-Employee Directors' Outstanding Stock Awards as of December 31, |
| |||
Name |
| Number of Shares Subject to Restricted Stock Units |
| |
John J. Huntz, Jr. |
|
|
|
|
Thomas E. Noonan |
|
|
| |
|
|
| ||
Deepak Raghavan |
|
|
|
|
Edmond I. Eger III |
|
|
|
|
Charles E. Moran |
|
|
| |
3,442 |
| |||
The Compensation Committee and the Board believe that each non-employee director and executive officer should have a meaningful personal investment in the Company, which is intended to further align the interests of our directors and executive officers with the long-term interests of our shareholders. Accordingly, in February 2018, the Company adopted share ownership guidelines for both non-employee directors and executive officers of the Company. Under the share ownership guidelines, each non-employee director is expected to own shares of Common Stock (not including unvested RSUs) with a market value equal to at least twothree times such director’stheir annual base cash retainer. This requirement must be met within five years of becoming a director or the adoption of the policy, whichever is laterlater. As of the Record Date, each non-employee director’s and executive officer’s share ownership would satisfy the guidelines.
Further, for the Company’s executive officers, the stock ownership guidelines are a multiple of annual base salary, as follows:
Executive Officer Title | Salary Multiple |
Chief Executive Officer | 4x |
Chief Financial Officer | 2x |
Senior Vice President, Americas | 2x |
Chief Legal Officer | 1x |
Chief Accounting Officer | 1x |
This requirement must be met within five years of becoming subject to the guidelines or the adoption of the policy, whichever is later.
19
The Company’s Global Ethics and Compliance Code, which is available in the Investor Relations section of our web site at www.manh.com, and which includes our conflicts of interest policy, provides generally that the Company’s Directors, officers, and employees must avoid any personal, financial, or family interest that could keep that person from acting in our best interest. In general, the Chief Legal Officer, who serves as the Company’s Chief Compliance Officer, must approve of exceptions to the policy as written. In addition, the Company has an unwritten policy requiring approval by the Audit Committee or the independent members of the Board of exceptions for conflicts involving Directors or executive officers.
Since the beginning of fiscal year 2012,January 1, 2020, the Company has not been a participant in any related-party transaction requiring disclosure pursuant to Item 404 of the SEC’s Regulation S-K, and no such transaction is currently proposed.
2022
Security Ownership of Certain Beneficial Owners and Management
FIVE PERCENT BENEFICIAL OWNERS OF COMPANY STOCK
The following table sets forth the amount and percent of shares of Common Stock held by holders that are deemed under SEC rules to be “beneficially“beneficial owners” of more than 5% of the outstanding shares of Common Stock as of March 5, 2018,2021, unless a different date is noted below.
| Common Stock Beneficially Owned (1) | |
Name of Beneficial Owner | Number of Shares of Common Stock | Percentage of Class |
Eaton Vance Management (2) | 8,138,354 | 12.09% |
Brown Capital Management, Inc. (3) | 7,845,670 | 11.66% |
BlackRock, Inc. (4) | 5,805,906 | 8.63% |
The Vanguard Group (5) | 5,756,656 | 8.55% |
Neuberger Berman Group LLC (6) | 5,268,639 | 7.83% |
| Common Stock Beneficially Owned (1) | |
Name of Beneficial Owner | Number of Shares of Common Stock | Percentage of Class |
The Vanguard Group (2) | 6,983,683 | 11% |
BlackRock, Inc. (3) | 5,791,403 | 9% |
Brown Capital Management, LLC (4) | 5,756,026 | 9% |
Eaton Vance Management (5) | 3,923,184 | 6% |
Neuberger Berman Group LLC (6) | 3,659,853 | 6% |
_____________
(1) | The percentage beneficially owned is based on |
(2) | Based on a Schedule 13G/A filed with the SEC on February |
(3) | Based on a Schedule 13G/A filed with the SEC on |
|
|
(4) | Based on a Schedule 13G/A filed with the SEC on February 12, 2021 by Brown Capital Management, LLC. All of these shares of Common Stock are owned by various investment advisory clients of Brown Capital Management, LLC, which is deemed to be a beneficial owner of those shares pursuant to Rule 13d-3 under the Securities Exchange Act of 1934, as amended, due to its discretionary power to make investment decisions over such shares for its clients and/or its ability to vote such shares. In all cases, persons other than Brown Capital Management, LLC have the right to receive, or the power to direct the receipt of, dividends from, or the proceeds from the sale of the shares. No individual client holds more than five percent of the class, other than the Brown Capital Management Small Company Fund. The address of Brown Capital Management, LLC is 1201 N. Calvert Street, Baltimore, MD 21202. |
(5) | Based on a Schedule 13G/A filed with the SEC on February |
(6) | Based on a Schedule 13G/A filed with the SEC on February |
2123
EXECUTIVE OFFICERS AND DIRECTORS
The following table sets forth the amount and percent of shares of Common Stock that, as of March 5, 2018, unless a different date is noted below,2021, are deemed under SEC rules to be “beneficially owned” by (i) each member of the Board and each nominee to become a member of the Board, (ii) the Chief Executive Officer, the Chief Financial Officer, and the other executive officers identified as the “named executive officers” in the Summary Compensation Table appearing in this Proxy Statement, and (iii) all Directors and executive officers of the Company as a group.
| Common Stock Beneficially Owned (1) | |
Name of Beneficial Owner | Number of Shares of Common Stock | Percentage of Class |
Eddie Capel(2) |
| * |
Edmond I. Eger III(3) |
|
|
|
| * |
Linda T. Hollembaek(4) |
| * |
John J. Huntz, Jr.(5) |
| * |
Charles E. Moran(6) |
| * |
Thomas E. Noonan(7) |
| * |
Deepak Raghavan(8) |
| * |
Dennis B. Story(9) |
| * |
Bruce S. Richards(10) |
| * |
Robert G. Howell(11) |
| * |
Linda C. Pinne(12) |
| * |
All executive officers and directors as a group (11 persons) |
| * |
_____________
* | Less than 1% of the outstanding Common Stock. |
(1) | The percentage beneficially owned is based on |
(2) | Does not include 124,765 shares represented by outstanding and unvested service-based RSUs and 64,620 shares represented by outstanding and unvested performance-based RSUs. |
(3) | Does not include 3,442 shares represented by outstanding and unvested service-based RSUs. |
(4) | Does not include 3,442 shares represented by outstanding and unvested service-based RSUs. |
(5) | Does not include 3,442 shares represented by outstanding and unvested service-based RSUs. |
(6) | Does not include 3,442 shares represented by outstanding and unvested service-based RSUs. |
(7) | Does not include 3,442 shares represented by outstanding and unvested service-based RSUs. |
(8) | Does not include 3,442 shares represented by outstanding and unvested service-based RSUs. |
(9) | Does not include 62,692 shares represented by outstanding and unvested service-based RSUs and 23,979 shares represented by outstanding and unvested performance-based RSUs. |
(10) | Does not include 18,248 shares represented by outstanding and unvested service-based RSUs and 8,694 shares represented by outstanding and unvested performance-based RSUs. |
(11) | Does not include 49,340 shares represented by outstanding and unvested service-based RSUs and 18,734 shares represented by outstanding and unvested performance-based RSUs. |
(12) | Does not include 7,696 shares represented by outstanding and unvested service-based RSUs and 2,943 shares represented by outstanding and unvested performance-based RSUs. |
Delinquent Section 16(a) Beneficial Ownership Reporting Compliance16(a) Reports
Section 16(a) of the Securities Exchange Act of 1934 requires the non-employee members of our Board of Directors and executive officers and persons who own beneficially more than 10% of our Common Stock to file reports of initial statements of ownership and statements of changes in ownership of such stock with the SEC. Directors, executive officers, and persons owning beneficially more than 10% of the Common Stock are required by the SEC to furnish the Company with copies of all Section 16(a) forms they file with the SEC. To the Company’s knowledge, based solely on the information furnished to the Company, all Directors, executive officers, and 10% shareholders complied with all applicable Section 16(a) filing requirements during the year ended December 31, 2017,2020, except for inadvertent late Form 4 reports filed on March 2, 2017February 10, 2020, by each of Messrs. Capel, Story, Howell and Richards and Ms. Pinne of one transactiontwo transactions exempt from liability under Section 16(b) of the Securities Exchange Act of 1934 relating to a restricted stock unit grant and the determination of performance-based restricted stock unit awards on January 26, 2017.awards.
22
24
Proposal 2 – Resolution to Approve Named Executive OfficerOfficers’ Compensation
Prior to voting on proposal 2, the Board recommends our shareholders review and consider our executive compensation philosophy, policy, and practices, all of which are summarized below and discussed in more detail in the Compensation Discussion and Analysis section of this Proxy Statement beginning on page 2426.
background
The Board believes our current executive compensation programs directly link executive compensation to our financial performance and align the interests of our executive officers with those of our shareholders. Our Board also believes our executive compensation programs provide our executive officers with a balanced compensation package that includes a reasonable base salary along with annual and long-term incentive compensation opportunities based on our performance against specified financial performance objectives.
While your vote is advisory and will not be binding on the Board, the Compensation Committee, or the Company, we strive to align our executive compensation programs with the interests of our long-term shareholders. As they do every year, the Board and the Compensation Committee will take into account the outcome of this year’s Say-on-Pay vote when considering future compensation actions and decisions.
say-on-pay proposal
The Board believes that our named executive officers’ (NEOs’) compensation is essential in attracting and retaining the high caliber of executive talent necessary to drive our business forward and build sustainable value for our shareholders. Accordingly, we are asking our shareholders to vote FOR the following resolution:
“RESOLVED, that the shareholders approve, on an advisory basis, the compensation of the named executive officers as disclosed in thisthe Proxy Statement for the 20182021 Annual Meeting of Shareholders pursuant to the compensation disclosure rules of the SEC (which disclosure includes the Compensation Discussion and Analysis, the 20172020 Summary Compensation Table and the other related tables and disclosures).”
Effect of say-on-pay vote
As indicated above, the vote on Proposal 2 is advisory and will not be binding on the Board, the Compensation Committee, or the Company. However, the Board values your opinions as expressed through your votes and other communications, it and our Compensation Committee will carefully review the 20182021 Say-on-Pay voting results to better understand any issues or concerns you may have with our executive compensation. Shareholders who want to communicate with our Board on executive compensation or other matters should refer to “Communication with the Board of Directors” on page 4549 of this Proxy Statement for additional information.
✓ | THE BOARD OF DIRECTORS UNANIMOUSLY RECOMMENDS A VOTE “FOR” THE APPROVAL OF THE EXECUTIVE COMPENSATION OF OUR NAMED EXECUTIVE OFFICERS, AS DISCLOSED IN THIS PROXY STATEMENT, PURSUANT TO THE COMPENSATION DISCLOSURE RULES OF THE SECURITIES AND EXCHANGE COMMISSION. |
2325
Compensation Discussion and Analysis
This Compensation Discussion and Analysis describes the compensation program for our Principal Executive Officer, our Principal Financial Officer, and the next three most highly-compensatedhighly compensated Executive Officers of the Company during 20172020 (the “named executive officers” or “NEOs”). These individuals are listed in the following table.
Name | Title | Page Number for Biography |
Eddie Capel | President and Chief Executive Officer ("CEO") |
|
Dennis B. Story | Executive Vice President, Chief Financial Officer, and Treasurer (“CFO”) |
|
Bruce S. Richards | Senior Vice President, Chief Legal Officer, and Secretary |
|
Robert G. Howell | Senior Vice President, Americas Sales |
|
Linda C. Pinne | Senior Vice President, Global Corporate Controller, and Chief Accounting Officer |
|
This Compensation Discussion and Analysis describes the material elements of our 20172020 executive compensation program. It also provides an overview of our executive compensation philosophy and objectives. Finally, it analyzes how and why our Compensation Committee arrived at the specific compensation decisions for our executive officers, including the 2017 named2020 NEOs and other executive officers, including the key factors the Compensation Committee considered in determining their compensation.
|
WeEXECUTIVE SUMMARY
As we continue to transition to a cloud-first company, we believe 20172020 was a year of substantial progress in positioning the Company for future long-term sustainable growth. Entering 2021, we remain focused on driving revenue growth and gaining market share. We note however our objectives for the year are subject to a number of risks and uncertainties, including the ongoing effects of the novel coronavirus disease (“COVID-19”) pandemic on global commerce, as well as the other factors set forth in Item 1A of the Company’s Annual Report on Form 10-K for the year ended December 31, 2020. We are confident in our long-term strategy driven by our market leadership in innovative supply chain and omnichannel solutions and services.
Among ourOur accomplishments we:include:
Continued to investAggressively investing in innovation and sought to expand ourexpanding total addressable market
| ✓ |
|
| ✓ | In May 2020, we launched our cloud-native Manhattan Active® Warehouse Management Solution, which we believe is the most advanced warehouse management system released in over a decade. The market reaction to this new product has been impressive with a double-digit number of deals closed to date and a growing pipeline. |
✓ | Our Manhattan Active® Solutions |
| ✓ |
|
Executed in a business transition and challenging retail macro environment
|
|
| ✓ | We invested $84 million in R&D, down 4% due to the effects of the COVID-19 pandemic, and plan to increase our investment in 2021. Our investment in R&D is a strategic priority to deliver meaningfully differentiated cloud innovation. We expect that innovation to expand our addressable market while helping us achieve long-term sustainable organic revenue growth and top quartile operating margins compared to other enterprise application software providers. |
Revenue and earnings performance was solid in the 3rd year of cloud transition
✓ | Total revenue was $586 million, down 5%, due to the impact of the COVID-19 pandemic. |
✓ | GAAP diluted EPS was $1.36, up 3% versus 2019, while Adjusted EPS was $1.76, up 1% versus 2019, reflecting our expense management. |
✓ | Customer retention rates were well above 90% |
| ✓ |
|
| ✓ | Recurring revenue as a percentage of total revenue, excluding hardware sales, rose from |
| ✓ |
|
✓ | 2020 GAAP operating margin of |
26
Maintained capital discipline and financial capacity
| ✓ | We closed |
| ✓ | Operating cash flow was |
| ✓ | In response to COVID-19, we took proactive measures to position the Company for uncertainty in the near-term. Those actions, effective April 1, 2020, included reduction of officer salaries and board of directors’ fees, suspension of our 401(k) plan company match, and suspension of our share repurchase program, all for the balance of 2020. |
✓ | We invested |
Our 2017 performance was influenced by delays in large investments in supply chain software by retail customers coupled with accelerated market adoption of
In 2020, we exceeded our cloud-based subscription services, and its correlative negative effecttarget objectives (as defined on up-front revenue recognition when compared to traditional perpetual software licenses.page 32 As a result, we did not achieve our consolidated revenue objective) for our annual cash bonus program and the performance-based component of our long-term equity (restricted stock unit) program, resulting in a reduced payout of 49% of the target payout to the named executive officers forunder our annual cash bonus program of 108% of target to all participants including our NEOs, and a 0% payout toearned performance-based equity under the named executive officers forperformance-based component of our 2017 performance-based2020 long-term equity program grants.at 108% of target for all participants including our NEOs.
Our total shareholder return (“TSR”) for 20172020 was negative seven percent (-7%)32%. Based on the Company’s stock price at December 31, 2017,2020, our CEO’s realizable compensation was down 43%19% above the target value, and our NEO’sother NEOs’ realizable compensation was collectively down 37% versus16% above their 2017 compensation targets. Despite our TSR, theThe Board of Directors believes that the Company made substantial progress toward
24
positioning the Company for long-term success, expanding its addressable market through investment in meaningfully differentiated investment in innovation and positioning Manhattan Associates for potential long-term sustainable growth.
CEO Target Versus Realizable Compensation
The “Target” bars represent Mr. Capel’s base salary, target annual cash bonus, and grant-date target value of long-term incentive compensation awards for 2015, 2016,2018, 2019, and 2017.2020. The “Realized”“Realizable” bars represent, as a percentage of target, the total of each year’s base salary paid, earned annual cash bonus, and the value of earned and long-term incentive award value as of(service-based and performance-based restricted stock unit (“RSU”) awards) based on the Company’s stock price at December 31, 2017.2020.

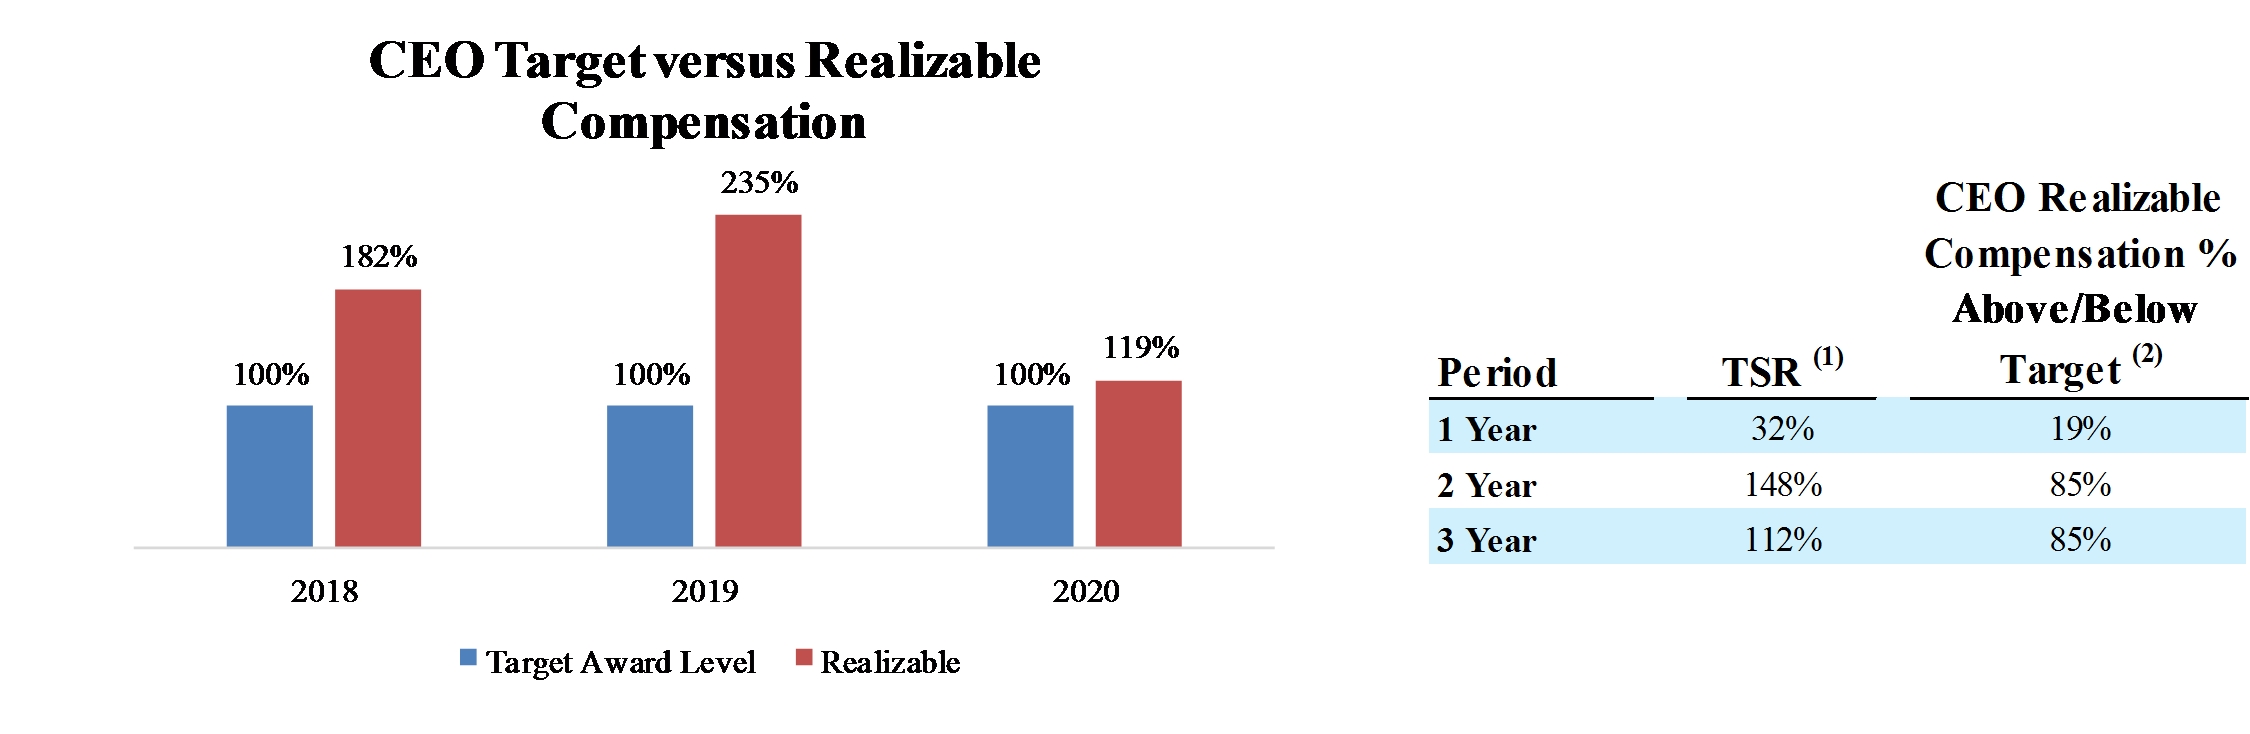
| (1) | TSR represents total shareholder return in 1 year |
| (2) | This column represents realizable CEO compensation versus target over the comparable TSR period. The realizable CEO compensation represents the accumulation of each period’s base salary paid, annual cash bonus, and long-term incentive award value as of |
Mr. Capel’s accumulated compensation for the past three years had an intended grant-datea target compensation value of approximately $12.7 million.$19.8 million (with equity awards valued at grant date). Based on the Company’s stock price at December 31, 20172020, and the Company’s performance for the past three years, we estimate the realizable value of thishis compensation was approximately $10.4$36.5 million, which was 18% below their intendedor 85% above the target compensation value. By design, our executive compensation program will not deliveris intended to align with creation of shareholder value, and the CEO’s realization of the target compensation value unlessof his compensation is impacted both by the Company meets or exceeds theCompany’s financial performance targets.against its targets and by shareholder return.
27
Our Compensation Philosophy
We are committed to a philosophy of pay-for-performance for our executives. Our executive compensation program is designed to achieve three primary objectives:
| 1. | Pay-for-Performance. Align actual compensation realized by our executive officers with achievement of our short-term and long-term business strategies, improving operational performance and |
| 2. | Market Competitiveness. Provide market competitive compensation opportunities to attract and retain executive officers and motivate them to perform at their highest level. |
| 3. | Shareholder Value Creation. Structure compensation through base salary, annual cash bonus opportunities, and a combination of service-based and performance-based equity awards, to promote increased shareholder value. |
20172020 Key Compensation Decisions
Our Compensation Committee’s key decisions for 20172020 pertaining to our named executive officersNEOs were as follows:
Base Salaries
| ✓ |
|
| ✓ |
|
|
|
Annual Cash Bonus
| ✓ | Our annual cash bonus program was based on three performance measures: Target Revenue, new annual contract value from cloud-based services (NACV) and adjusted operating income (AOI), all as defined on page 33. Based on our |
25
Long-term Incentive Compensation
| ✓ | Our 2020 long-term equity grants to our NEOs were 50% service-based RSUs and 50% performance-based RSUs with three performance measures: Target Revenue, NACV, and AOI. Based on our |
2018 Key Compensation Actions
|
|
|
|
Compensation Policies and Practices
Alignment between Company performance and executive compensation is the cornerstone of our executive compensation philosophy and program design. We also believe our overall governance of executive compensation is sound and reflects many best practices, including:
| ✓ | Separate CEO and Chairman of the Board |
| ✓ |
|
| ✓ |
|
| ✓ | Capped incentive opportunities to mitigate concerns regarding excessive risk-taking for all employee participants |
| ✓ | Equity |
| ✓ | “Double-trigger” change-in-control arrangements |
| ✓ | No excise tax gross-ups |
| ✓ | Limited executive perquisites |
| ✓ |
|
28
In approving compensation arrangements for 2018,2021, the Compensation Committee considered the pay-for-performance results and governance practices highlighted above, as well as the voting result on the 20172020 “say on pay” proposal that was in favor of the Company’s executive compensation program.
Compensation of our Chief Executive Officer
Our CEO participates in the same executive compensation programs as our other executive officers, including the other named executive officers.NEOs. In determining compensation for our CEO, the Compensation Committee considers the same information and factors used in determining compensation for the other named executive officers,NEOs, except that our CEO does not make a recommendation to the Compensation Committee for his own compensation.
For 2017,2020, the Compensation Committee set Mr. Capel’s annual base salary at $575,000,$620,000, with a target annual cash bonus opportunity equal to 100% of his base salary. The Company granted Mr. Capel a regular equity award of 47,77460,297 RSUs (50% of which were service-based and 50% of which were subject to performance-based objectives). In response to COVID-19, effective April 1, 2020, the Company reduced the base salary of our President and CEO by 25% for the remainder of 2020.
Based on our 2020 achievement against the performance measures under our short-term and long-term incentive programs (Targeted Revenue, NACV, and AOI, as defined on page 33, achieved at 108%), Mr. Capel earned a cash bonus of $669,600 and 108% of the performance-based component of his 2020 performance-based RSU award (which equaled 32,561 shares), which will vest over four years.
Mr. Capel’s accumulated compensation for 20172020 had an intendeda target grant-date value of approximately $3.6$6.5 million (annual salary, cash bonus and equity compensation). Based on the Company’s stock price at December 31, 2017,2020, and the Company’s performance for the year, the earned value of his award was approximately $2.0$7.8 million, which was down 43%up 19% from total compensation target compensation value (see chart on page 25)27). Based on our 2017 revenue and adjusted earnings per share, as defined in our programs, Mr. Capel earned a cash bonus of $281,750, but did not earn any of his 2017 performance-based RSU award.
Determining Executive Compensation
The Role of the Compensation Committee
The Compensation Committee is responsible for determining the compensation of our executive officers, including the named executive officers,NEOs, and for administering our StockEquity Incentive Plan. The Compensation Committee currently comprisesconsists of three non-employee Directors: Messrs. Noonan (Chairman), Eger,Huntz, and Huntz.Moran. The Compensation Committee’s overall objective is to establish a compensation policy that will (i) attract, retain, and reward executives who will and do contribute to achieving our business objectives, (ii) motivate our executive officers to obtainachieve those objectives, and (iii) align the interests of our executive officers with those of our long-term shareholders.
26
The Role of Compensation Consultant
The Compensation Committee has the authority to retain compensation consultants and other advisors to assist it in performing its duties. In 2017,2020, the Compensation Committee engaged Compensia,Willis Towers Watson (through its subsidiary company Towers Watson Delaware Inc.) (“WTW”), as its compensation consultant. CompensiaWTW reports to and is directed by the Compensation Committee. In general, the Compensation Committee directs CompensiaWTW to provide periodic updates on market trends and developments, provide relevant and credible market data for assessing pay competitiveness, evaluate the alignment of the design of our executive compensation program with our business strategy, performance outcomes, and competitive pay practices, and participateWTW participates in Compensation Committee meetings where substantive executive compensation decisions are being made. The Company paid approximately $40,000 to WTW for those services provided in 2020.
In 2017,connection with its review of WTW’s independence, the Compensation Committee considered the six specific independence factors adopted by the SEC and the Nasdaq Stock Market and determined that CompensiaWTW is independentindependent. In conducting its review, the Committee considered that one or more WTW corporate affiliates provide the Company brokerage and other services related to the Company’s employee healthcare and other group benefits, and that the Company paid those affiliates for those services approximately $169,000 in 2019 and $274,000 in 2020, and anticipates paying similar amounts in 2021. In concluding that the provision to the Company of healthcare and other group benefits services by those WTW affiliates does not constitute a conflict of interest that would compromise WTW’s independence, the Committee considered the following WTW representations and other information obtained as part of its work did not raise any conflicts of interest.due diligence:
✓ | WTW has separated its compensation consulting services into a single, segregated business unit within WTW. |
29
✓ | The Committee was solely responsible for the decision to engage WTW, the Committee made its decision independent of any influence from others at the Company, and the Committee conducted its independence review prior to finalizing the engagement. |
✓ | WTW has represented that: |
o | WTW has in place safeguards between its executive compensation consultants serving our Compensation Committee and the brokerage services provided to the Company to prevent any compromise of the independence of WTW’s executive compensation services. |
o | Neither WTW’s lead executive compensation advisor for our engagement nor any member of that lead advisor’s team participates in any activities related to the brokerage services provided by the WTW brokerage services affiliate to the Company. |
o | Individuals who are not part of the executive compensation consulting team for our Compensation Committee (other than designated quality reviewers) are precluded from involvement in the development of recommendations regarding the compensation of the Company’s executive officers and directors. |
o | WTW executive compensation consultants who advise our Compensation Committee on the compensation of executive officers and directors may not serve in broader relationship-management roles for our Company. |
o | The compensation paid to WTW executive compensation consultants is not directly tied to the fees paid, or to the expansion of the fees paid, by the Company, and the WTW executive compensation advisors receive no direct incentives based on other WTW services to the Company. |
✓ | WTW’s executive compensation associates are subject to their comprehensive Code of Business Conduct, which addresses conflicts of interest, and in that regard, WTW has represented that (i) the advice rendered by WTW to our Compensation Committee is not influenced by any other WTW work for the Company and (ii) the executive compensation consulting approaches that WTW follows and conclusions they reach are unaffected by the number or magnitude of any other services WTW provides to the Company. |
✓ | Company management purchases the brokerage services from the WTW brokerage services affiliate in the ordinary course of business, and manages the relationship with that affiliate, without involvement of our Compensation Committee. |
The Role of Senior Management
Our CEO generally makes recommendations to the Compensation Committee regarding compensation for the named executive officersNEOs other than himself. Our CFO and Senior Vice President, Human Resources provide support to our CEO with respect to data, analysis, and advice in formulating specific compensation recommendations. The Chief Legal Officer generally attends Compensation Committee meetings, prepares meeting minutes and resolutions, and is available for legal counsel as required.
Competitive Market Data
The Compensation Committee considers competitive market data when making pay determinations for our executive officers, including the named executive officers.NEOs. This is only one of many factors the Committee considers when making pay determinations, and the Committee does not benchmark or target a precise percentile or pay level relative to this information. Instead, the Compensation Committee uses this information as a general guide to determine if our executive compensation levels in the aggregate and by element are within a reasonable range compared with similar companies.
The precise nature of our competitive market analysis varies each year based on the needs of the Company and the Compensation Committee in making pay determinations. Generally, the Committee evaluates competitive market practices using data drawn from both a group of peer companies and published compensation survey data.data (Radford’s Global Technology Survey). For purposes of determining 20172020 compensation, the Compensation Committee used a peer group comprising the following companies:
30
Company Name | Company Ticker | Market Cap
2019 |
Manhattan Associates, Inc. | MANH |
|
8x8, Inc. | EGHT | 2.2 |
ACI Worldwide, Inc. | ACIW |
|
Aspen Technology, Inc. | AZPN |
|
Blackbaud, Inc. | BLKB |
|
Bottomline Technologies, Inc. | EPAY | 1.8 |
Commvault Systems, Inc. | CVLT | 2.1 |
Cornerstone OnDemand, Inc. | CSOD |
|
|
|
|
Fair Isaac Corp. | FICO | 9.4 |
FireEye, Inc. | FEYE |
|
Five9, Inc. | FIVN | 3.4 |
Guidewire Software, Inc. | GWRE |
|
|
|
|
|
|
|
|
|
|
Paylocity Holding Corp. | PCTY |
|
|
|
|
Proofpoint, Inc. | PFPT |
|
RingCentral, Inc. | RNG |
|
|
|
|
SPS Commerce, Inc. | SPSC |
|
|
|
|
Tyler Technologies, Inc. | TYL |
|
|
|
|
* During 2020 and subsequent to this analysis, LogMeIn, Inc., became a privately owned company.
The Compensation Committee annually reviews pay and performance data from the compensation peer group as well as pay data from various compensation surveys. Both the peer group and survey data included companies that were comparable to the Company with respect to revenue level, market capitalization, industry segment, and competitive employment market. The specific peer companies,
27
survey sources, and forms of analysis change from year to year based on the best available data and the key priorities of the Compensation Committee. The Committee considered this information along with other relevant information, such as the Company’s performance and that of each executive officer. Our CEO also presented recommendations to the Compensation Committee for our executive officers (other than himself). No other executive officer has direct input to the Compensation Committee regarding the compensation of the namedNEOs.
For the 2020 market analysis used in establishing target executive officers.compensation for 2021, the Committee approved changes to the peer group: removing Ring Central, Inc., and LogMeIn, Inc.
Shareholder Advisory Vote on Named Executive OfficerOfficers Compensation
Our Board values your opinions as expressed through votes and other communications with us, it and our Compensation Committee carefully reviewreviews our annual Say-on-Pay voting results to better understand any issues or concerns you may have with our executive compensation.
In 2017,2020, holders of approximately 72%93% of our shares of Common Stock voting on our 20172020 Say-on-Pay proposal approved of our executive compensation program for our named executive officers, which was lower than our historical average of 98% for 2014 through 2016. The lower approval vote was influenced by a recommendation to vote “against” our 2017 advisory Say-on-Pay proposal because our executive employment agreements with our executive officers included as a constructive termination event the Company’s insolvency or filing for bankruptcy following a change in control. In 2018, consistent with good governance practices, the executive employment agreements were amended to eliminate that constructive termination event.NEOs.
Principal Elements of Executive Compensation
We compensate our executive officers with a combination of base salary and short-term and long-term incentives designed to focus their efforts on maximizing both our short-term and long-term financial performance. The executive compensation program includes the following: (i) base salary, (ii) annual cash bonus, (iii) long-term incentive compensation in the form of equity awards, and (iv) other benefits. Each executive officer’s compensation package is designed to provide an appropriately weighteda mix of these elements, which the Compensation Committee believes provides a level of compensation roughly equivalent to that paid by companies of similar size and complexity and that balances short-term and long-term performance and reward objectives.
31
Base Salary
Minimum salaries for the named executive officersNEOs are established in their employment agreements. The Compensation Committee annually reviews the base salaries of the named executive officers are reviewed annually by the Compensation CommitteeNEOs for adjustment. When establishing base salaries of our executive officers for 2017,2020, the Compensation Committee considered competitive market data (drawn from compensation survey data and the compensation peer group), as well as a variety of other factors, including global macro-economic conditions, market developments, our past financial performance and future expected performance, the performance of the executives, changes in the executives’ responsibilities, the CEO’s recommendations (other than for his own base salary) and cost-of-living and other local geographic considerations, where applicable. The actual base salaries paid to
To help position the named executive officers in 2017 are disclosedCompany for uncertainty in the Summary Compensation Table.near-term caused by the COVID-19 pandemic, effective April 1, 2020, the Company reduced the base salary of our President and CEO by 25%, our EVP and CFO by 15%, and our other NEOs by 10% for the remainder of 2020. In December 2020, our Board approved repayment of our NEOs’ salary reductions, except for our CEO and CFO. The Company repaid those reductions in January 2021. The following table sets forth each NEO’s base salary and amount earned in 2020.
Name and Principal Position | Annual Base Salary | Salary Reduction |
| Earned Salary | |
|
|
|
|
| |
Eddie Capel | $620,000 | ($116,250) (1) |
| $503,750 | |
President, Chief Executive Officer, and Director |
|
|
|
| |
Dennis B. Story | 429,000 | (48,262) (1) |
| 380,738 | |
Executive Vice President, Chief Financial Officer, and Treasurer |
|
|
|
| |
Bruce S. Richards | 338,000 | - (1) |
| 338,000 | |
Senior Vice President, Chief Legal Officer, and Secretary |
|
|
|
| |
Robert G. Howell | 344,000 | - (1) |
| 344,000 | |
Senior Vice President, Americas Sales |
|
|
|
| |
Linda C. Pinne | 263,345 | -(1) |
| 263,345 | |
Senior Vice President, Global Corporate Controller, and Chief Accounting Officer |
|
|
|
| |
(1)In April 2020, the Company reduced the base salary in 2020 but repaid those reduction in January 2021. | |||||
The following table sets forth each named executive officer’sNEO’s target annual cash bonus, payout amount, and payout percentage actually earned in 2017.2020.
|
|
|
| 2017 Annual Cash Bonus Program Target vs. Payout |
|
|
|
| 2020 Annual Cash Bonus Program Target vs. Payout |
| ||||||||
Name |
| Title |
| Target |
| Payout |
| Payout % |
|
| Title |
| Target |
| Payout |
| Payout % (1) |
|
Eddie Capel |
| President, Chief Executive Officer, and Director |
| $575,000 |
| $281,750 |
| 49% |
|
| President, Chief Executive Officer, and Director |
| $620,000 |
| $669,600 |
| 108% |
|
Dennis B. Story |
| EVP, Chief Financial Officer, and Treasurer |
| 286,000 |
| 140,140 |
| 49% |
|
| EVP, Chief Financial Officer, and Treasurer |
| 320,000 |
| 345,600 |
| 108% |
|
Bruce S. Richards |
| SVP, Chief Legal Officer, and Secretary |
| 179,000 |
| 87,710 |
| 49% |
|
| SVP, Chief Legal Officer, and Secretary |
| 196,000 |
| 211,680 |
| 108% |
|
Robert G. Howell |
| SVP, Americas Sales |
| 300,000 |
| 147,000 |
| 49% |
|
| SVP, Americas Sales |
| 340,000 |
| 367,200 |
| 108% |
|
Linda C. Pinne |
| SVP, Global Corporate Controller, and Chief Accounting Officer |
| 82,164 |
| 40,261 |
| 49% |
|
| SVP, Global Corporate Controller, and Chief Accounting Officer |
| 92,170 |
| 99,544 |
| 108% |
|
(1) | See the table entitled “Annual Cash Bonus Program Design for 2020” on page 34 to see how we calculate the 2020 annual bonus. |
The purpose of the Company’s annual cash bonus program is to align short-term incentive bonuses with the achievement of annual corporate performance. Each plan participant has a target bonus, which is expressed as a percentage of their base salary, and the actual bonus they receive is based on the Company’s level of achievement against three performance measures. For all the named executive officers,NEOs, as well as all other employee participants in the program during 2017,2020, the Compensation Committee used consolidated revenueTarget Revenue, NACV, and adjusted earnings per share (“adjusted EPS”)AOI as the corporate performance measures to determine the bonus payouts.payouts (see definitions below). The Compensation Committee believes the combination of consolidated revenueTarget Revenue, NACV, and
28
adjusted EPS AOI creates the proper balance for motivating and rewarding profitable growth in the near-term that will translate into strong returns for shareholders over the long-term. The Compensation Committee excluded individual performance from the bonus measures for all program participants to focus and reward the team for collectively achieving our overall financial objectives.
For 2017, and in accordance with its recent years’ practice, the Compensation Committee weighted the two performance measures (consolidated revenue and adjusted EPS) equally, and for each, established performance ranges with each range having a minimum performance threshold, a target threshold, and a performance maximum. Achievement above the minimum threshold for a performance measure is expressed as a percentage of the target level, and the percentages for the two performance measures are averaged together to determine the annual bonus payout by multiplying that average percentage by the target bonus payout. At- or below-minimum threshold performance for a measure is expressed as 0%, at-target performance is expressed as 100%, and performance at the maximum is expressed as 150%. Achievement between the minimum performance threshold and target, or between target and the performance maximum, is expressed as a percentage determined by linear interpolation. The Company may make interim quarterly bonus payments if interim minimum performance thresholds are exceeded during the course of the year, even if full-year minimum thresholds are not ultimately met. If the annual target levels are exceeded, the executive officers will receive more than their target bonus opportunity in the final quarter of the year, as interim quarterly incentive payouts are capped at 100% of target.32
As an example, if the percentages of target achieved for the respective performance measurements (consolidated revenue and adjusted EPS) are 80% and 110%, respectively, and the annual target bonus payout for an executive is $300,000, then the annual bonus payout to that executive would be [(0.80 + 1.10) / 2] x $300,000 = $285,000.
Regarding the establishment of the specific consolidated revenue and adjusted EPS performance measures for 2017, the Compensation Committee reviewed and considered senior management’s proposed 2017 budget, the critical assumptions underlying the budget, and the final budget. In preparing the budget, senior management considered a variety of factors, including but not limited to: global economic trends, supply chain management information-technology investment and growth trends as published by leading industry analysts, the competitive position of our software products, the level of investment in product development to maintain sustainable competitive advantage, and historical financial performance. Senior management considers these factors in the context of the key objective of extending the Company’s position as a leading global supply chain commerce solutions provider by increasing our revenues faster than our competitors.
In setting the consolidated revenue and adjusted EPS performance measures for 2017, the Compensation Committee considered the degree of difficulty and probability of achieving the performance levels. The Committee set these levels so that the relative difficulty of achieving them were consistent with prior years.
For purposes of the 20172020 bonus program, for all plan participants:
| ✓ | As defined in the program, |
✓ | As defined in the program, AOI excludes the following items from GAAP |
| ✓ |
|
| Consistent with prior years, |
Regarding our use of adjusted EPS as one of the performance measures,AOI, we use adjusted EPSAOI to develop our budget, manage expenditures, and evaluate our overall business performance, and we believe adjusted EPSAOI is useful for us, and for our investors, when assessing our performance versus other software companies. We included in ourOur February 6, 20182, 2021, earnings press release, attached to our Current Report on Form 8-K of the same date, included a full reconciliation from 20172020 GAAP EPSoperating income to 2017 adjusted EPS2020 AOI (non-GAAP EPS)operating income).
Regarding the establishment of the specific Target Revenue, NACV, and AOI performance measures for 2020, the Compensation Committee reviewed and considered senior management’s proposed 2020 budget and the critical assumptions underlying the final budget. In preparing the budget, senior management considered a variety of factors, including but not limited to: global economic trends, our business transition to cloud-based services, supply chain management information-technology investment and growth trends as published by leading industry analysts, the competitive position of our software products, the level of investment in product development needed to maintain sustainable competitive advantage, and historical financial performance. Senior management considers those factors in the context of the key objective of extending the Company’s position as a leading global supply chain commerce solutions provider. The Compensation Committee also considered the degree of difficulty and probability of achieving the performance levels with the Company’s business transition to cloud. The Committee set these levels so that the relative difficulty of achieving them were consistent with prior years.
For the 2020 cash bonus program, the Compensation Committee weighted the corporate performance measures as follows: Target Revenue – 25%; NACV – 25%; AOI – 50%. For each measure, the Committee established performance ranges, with each range having a minimum performance threshold, performance target, and performance maximum. For each performance measure, achievement at the performance target pays out 100% of a target bonus payout for that measure, achievement at or below the minimum performance threshold pays out zero for that measure, and achievement at or above the performance maximum pays out 150% of the target payout for that measure. We determine the bonus payout percentage for achievement between the minimum performance threshold and target, or between target and the performance maximum, by linear interpolation. The annual total bonus payout percentage under the plan is the weighted average of the performance percentages for the three performance measures. The Compensation Committee has discretion to adjust final annual bonus amounts, which it did not exercise in 2020. For 2020, as in prior years, the Committee established quarterly minimum performance thresholds and targets adding up to the annual thresholds and targets, so that plan participants could earn and receive interim quarterly bonus installments, provided that those payments could not exceed the respective quarterly targets. Because of that, it was possible plan participants could receive some level of payout even if full-year minimum thresholds ultimately were not met, and it was possible that, if the annual target performance levels were achieved, the final quarterly bonus installment could exceed target for the final quarter.
33
The following table provides the 20172020 annual cash bonus payout levels as a percentage of the performance targets for consolidated revenueTarget Revenue, NACV, and adjusted EPS.
29
AOI.
Annual Cash Bonus Program Design for 2017 | ||||||||||||||||
|
|
|
|
|
|
|
|
|
|
|
|
|
|
|
|
|
|
|
|
| Participant |
|
|
| Amount |
| Participant Bonus Payout % of Target |
| Actual Payout % Earned |
| Payout Weight |
| Weighted Actual Payout % Earned |
|
|
|
| Bonus Payout |
| Actual Payout | ||||||||||
|
| Amount |
| % of Target |
| % Earned | ||||||||||
Consolidated Revenue ($ in millions) |
|
|
|
|
|
| ||||||||||
Target Revenue ($ in millions) - Weighting 25% | Target Revenue ($ in millions) - Weighting 25% | |||||||||||||||
Threshold goal |
| $552.3 |
| 0% |
|
|
| $521.3 |
| 0% |
|
|
|
|
|
|
Target goal |
| 577.7 |
| 100% |
|
|
| 537.3 |
| 100% |
|
|
|
|
|
|
Maximum goal |
| 629.6 |
| 150% |
|
|
| 558.9 |
| 150% |
|
|
|
|
|
|
|
|
|
|
|
|
|
|
|
|
|
|
|
|
|
|
|
2017 Bonus Revenue – Earned |
| $526.6 |
|
|
| 0% | ||||||||||
2020 Bonus Revenue - Earned |
| $485.2 |
|
|
| 0% |
| 25% |
| 0% | ||||||
|
|
|
|
|
|
|
|
|
|
|
|
|
|
|
|
|
Adjusted EPS |
|
|
|
|
|
| ||||||||||
New Annual Contract Value (NACV) - Weighting 25% | New Annual Contract Value (NACV) - Weighting 25% | |||||||||||||||
2020 Bonus NACV - Earned |
| * |
|
|
| 136% |
| 25% |
| 34% | ||||||
|
|
|
|
|
|
|
|
|
|
| ||||||
Adjusted Operating Income (AOI) ($ in millions) - Weighting 50% |
|
|
|
|
|
|
|
|
|
| ||||||
Threshold goal |
| $1.87 |
| 0% |
|
|
| $122.1 |
| 0% |
|
|
|
|
|
|
Target goal |
| 1.93 |
| 100% |
|
|
| 129.9 |
| 100% |
|
|
|
|
|
|
Maximum goal |
| 2.13 |
| 150% |
|
|
| 146.8 |
| 150% |
|
|
|
|
|
|
|
|
|
|
|
|
|
|
|
|
|
|
|
|
|
|
|
2017 Bonus EPS – Earned |
| $1.86 |
|
|
| 0% | ||||||||||
2020 Bonus AOI - Earned |
| $146.0 |
|
|
| 147% |
| 50% |
| 74% | ||||||
|
|
|
|
|
|
|
|
|
|
|
|
|
|
|
|
|
Total Combined Actual Payout % Earned |
|
|
| 0% | ||||||||||||
Total Combined Actual Payout % Earned [(0% x 25%) + (136% x 25%) + (147% x 50%)] = 108% |
|
|
|
|
|
|
|
|
| 108% | ||||||
Payouts for consolidated revenue and adjusted EPS amounts achieved between threshold goal and target goal and between target goal and maximum goal are calculated based on linear interpolation.
* We achieved consolidated revenuedo not disclose the NACV performance target and bonus EPS for 2017 of $526.6 million and $1.86 per share, respectively, which were below the minimum annual threshold for bonus payouts at year end. Delays in large investments in supply chain software by retail customers coupledactual level achieved. We believe that disclosure would provide our competitors with accelerated market adoption ofinsight into our cloud-based subscription services, and its correlative negative effect on up-front revenue recognition when compared to traditional perpetual software licenses, factored heavily in these results. The effect of these factors, however, increased as 2017 progressed, with their impact being most deeply felt towards the end of the year. Consequently, performance against the established objectives was above minimum payout thresholds for the year-to-date period ending September 30, 2017,operations, resulting in interim incentive bonus payouts of 49% ofserious competitive harm. The Compensation Committee set the annualNACV target during the year.based on our historical results, growth rates, and expected future results, and intended for it to require significant effort to achieve.
The Compensation Committee retains the right to exercisehas discretion to either increase or decrease a participant’s annual cash bonus under the bonus program. As in recent years, the Compensation Committee did not exercise its discretion with regard to the cash bonuses to our executive officers in 2017, which were paid in accordance with the express terms of the plan. With respect to the cash bonuses paid under the plan, the Compensation Committee considered that the positive market reaction to the Company’s cloud-based solutions, while having a temporary negative effect on revenues, was a positive achievement.2020.
Long-term Incentive Compensation
The following table sets forth each named executive officer’sNEO’s target annual long-term incentive opportunity, earned amounts at December 31, 2017,2020, and change in total value percentages in 2017.2020. The closing market price of the Company’s Common Stock on December 31, 2020, was $105.18, representing a 32% TSR since December 31, 2019.
2017 Long-Term Incentive Compensation Target vs. Payout | ||||||||||||||||||
Value of 2020 Long-Term Incentive Compensation | Value of 2020 Long-Term Incentive Compensation | |||||||||||||||||
Target (1) |
| Earned Value at 12/31/2017 (2) |
| % Change | Target Value (1) |
| Value at 12/31/2020 (2) |
| % Change | |||||||||
Name | RSU | PSU | Total |
| RSU | PSU | Total |
| Total | RSU | PSU | Total |
| RSU | PSU | Total |
| Total |
Eddie Capel | $1,215,371 | $2,430,742 |
| $1,183,362 | $0 | $1,183,362 |
| -51% | $2,647,597 | $2,647,685 | $5,295,282 |
| $3,170,967 | $3,424,766 | $6,595,733 |
| 25% | |
Dennis B. Story | 437,517 | 437,568 | 875,085 |
| 425,994 | $0 | 425,994 |
| -51% | 806,890 | 806,978 | 1,613,868 |
| 966,394 | 1,043,912 | 2,010,306 |
| 25% |
Bruce S. Richards | 218,784 | 437,568 |
| 213,022 | $0 | 213,022 |
| -51% | 292,528 | 585,056 |
| 350,355 | 378,438 | 728,793 |
| 25% | ||
Robert G. Howell | 437,517 | 437,568 | 875,085 |
| 425,994 | $0 | 425,994 |
| -51% | 630,372 | 630,460 | 1,260,832 |
| 754,982 | 815,566 | 1,570,548 |
| 25% |
Linda C. Pinne | 60,751 | 60,802 | 121,553 |
| 59,151 | $0 | 59,151 |
| -51% | 105,911 | 211,822 |
| 126,847 | 137,050 | 263,897 |
| 25% | |
______________
(1) | These columns represent the aggregate grant date fair value for service-based and performance-based RSU awards. We |
3034
We use equity awards to provide incentives to improve our financial performance and to assist in the recruitment, retention, and motivation of professional, managerial, and other personnel. These long-term incentives are designed to align the interests of our executive officers and other employee plan participants with those of our shareholders to enhance our overall value, the market price of the Common Stock, and as a result, our shareholders’ return. In addition, the vesting of stockequity incentives over time is designed to create an incentive for our people to remain with us. We grant RSUs to our executive officers and select other employee plan participantsemployees on an ongoing basis to provide continuing incentives to them to meet future performance goals and to remain with the Company.
Equity-based compensation is an important component of our executive compensation program. In setting the form and level of the equity awards for the named executive officers,NEOs, the Compensation Committee considers the CEO’s recommendations, the executive officer’s performance, and a variety of other factors including:
✓Market-competitive levels of total compensation, particularly for our peer group
✓Market-competitive levels and forms of equity-based compensation
✓Alignment with company performance and shareholder value
✓The retention strength provided by outstanding and unvested equity awards held by the executives
✓Global macro-economic conditions
✓Our recent performance and trends
✓The executive’s recent performance and potential future contribution
✓The resulting annual grant rate from aggregateall awards
✓The availability of shares under our shareholder approved equity plansplan
✓Our cost and its alignment with participant value
There is no precise formula or weighting applied to these factors as changing business conditions, competitive market practices, and regulations necessitate differing priorities to maximize effectiveness while minimizing cost and dilution.
During 2017,2020, the Company granted to the NEOs an aggregate of 93,161 RSUs were granted to the named executive officers.102,105 RSUs. In approving the individual award levels for the annual NEO grants, to the named executive officers, the Compensation Committee also reviewed aggregate grant levels for all recipients to ensure the annual grant rate was within competitive norms and sustainable over time.
The annual awards granted in 20172020 are 50% service-based (46,579 shares) and 50% performance-based (46,582 shares) and generallyperformance-based. They vest in four equal annual increments starting on or about the first anniversary of the grant date, for both service-based and performance-based grants, with the performance portion tied to the same annual revenueTarget Revenue, NACV, and adjusted earnings per shareAOI performance goalsmeasures and ranges for fiscal year 20172020 as established for the annual cash incentivebonus plan discussed above. Our performance goals are focused on internal key financial metrics that drive long-term value creation, such as Target Revenue, NACV, and AOI. Our past financial performance demonstrates, and we fully expect, that meeting these metrics will over time translate into increased shareholder value. For equity-based awards, our share price ultimately should reflect whether we have executed this strategy successfully, and we intend that the four-year vesting schedule for equity grants will ensure our officers maintain a long-term perspective. A look at our historical stock prices over the last 10 years shows a growth rate of 1,277%, from a stock price of $7.64 on December 31, 2010, to $105.18 on December 31, 2020, after giving effect to stock splits during this period. We believe this growth demonstrates that the achievement of our performance goals over this period resulted in creation of long-term value for our shareholders. Our long-term strategy emphasizes continued growth through a capital allocation approach coupling investment in innovation with a disciplined return of capital to shareholders self-funded through free cash flow.
TheWe intend the performance-based RSUs are intended primarily to provide our executive officers with incentives to improve our performance, as they benefit from these awards only if we meet the pre-established financial goals specified in the awards in the year granted. The 20172020 performance-based RSU awards were to be earned, in whole or in part, based on our attainment of the same annual consolidated revenueTarget Revenue, NACV, and adjusted EPSAOI performance goals as established for the 20172020 annual cash bonus program. For 2017, and in accordance with its recent years’ practice,2020, the Compensation Committee weighted the twocorporate performance measures (consolidated revenue and adjusted EPS) equally, and foras follows: Target Revenue – 25%; NACV – 25%; AOI – 50%. For each measure, the Committee established performance ranges, with each range having a minimum performance threshold, a target threshold, and a performance maximum. Achievement above the minimum threshold for aFor each performance measure, is expressed as a percentage ofachievement at the target level, andthreshold results in the percentages for the two performance measures are averaged together to determineexecutive earning 100% of the number of performance-based RSUs angranted to them, achievement at or below the minimum performance threshold results in the executive earns by multiplyingearning zero performance-based RSUs for that average percentage bymeasure, and achievement at or above the performance maximum results in the executive earning 150% of the number of performance-based RSUs initially granted togranted. We determine the executive. At- or below-minimum threshold performancepercentage of the performance-based RSUs earned for a measure is expressed as 0%, at-target performance is expressed as 100%, and performance at the maximum is expressed as 150%. Achievementachievement between the minimum performance threshold and target, or between target and the performance maximum, is expressed as a percentage determined by linear interpolation. The total percentage of performance-based RSUs earned is the weighted average of the performance percentages for the three performance measures. Under the 20172020 program, for an executive to earn any of their performance-based RSUs, we were required to exceed one or bothmore of the minimum performance thresholds.
As an example, if the percentages of target achieved for the respective performance measurements (consolidated revenue and adjusted EPS) are 75% and 105%, respectively, and the number of performance-based RSUs granted during to the executive during 2017 was 8,000, then the number of those performance-based RSUs earned by that executive would be [(0.75 + 1.05) / 2] x 8,000 RSUs = 7,200 RSUs, with the remaining 800 RSUs being canceled. 35
AsBased on our full yearfinancial performance in 2017 was below the minimum threshold,2020, the named executive officers did not earn anyearned 108% of the granted performance-based RSUs awarded.RSUs. The minimum performance threshold, performance target, and performance maximum for the
31
2017 2020 performance measures, as well as our actual performance, are the same as set forth in the table “Annual Cash Bonus Program Design for 2017.2020.”
Perquisites and Other Personal Benefits.
Currently, we do not view perquisites or other personal benefits as a significant component of our executive compensation program. Accordingly, we do not provide perquisites or other personal benefits to our executive officers, including the named executive officers,NEOs, except in situations where we believe it is appropriate to assist an individual in the performance of their duties, to make our executive officers more efficient and effective, and for recruitment and retention purposes.
If an executive officer qualifies to attend our annual sales-oriented Presidents’President’s Club event and incurs an income tax liability associated with their attendance and the attendance of their spouse, we provide a tax “gross-up” payment to offset that liability. During 2017,2020, we provided a tax gross-up payment, with respect to our CEOthis event, to Messrs. Capel, Howell, Richards, and Mr. Howell.Story.
Health and Welfare Benefits.
We offer standard Company health and welfare benefits to the named executive officersNEOs as a safety net against the financial catastrophes that can result from illness, disability, or death. The benefits offered to the named executive officersNEOs are substantially the same as those offered to all our regular employees, except that certain of the named executive officersNEOs have been provided an arrangement under which the Company pays the premiums on term life insurance on their lives during their continued employment with the Company. During 2017,2020, we paid term life insurance premiums, including income tax “gross-ups” with respect to those premiums, for Messrs. Capel, Story, Richards, and Howell.
Our tax-qualified deferred-compensation Section 401(k) Savings Plan covers all our eligible full-time employees. Under the plan, participants may elect to contribute, through salary deductions, up to 60% of their annual compensation, subject to a maximum of $18,000,$19,500, or $24,000$26,000 for employees who are at least 50 years old. We provide 50% matching contributions iupup to the first 6% of salary contributed under the plan. The plan is designed to qualify under Section 401 of the Internal Revenue Code so that our employees’ and our contributions, and income earned on those contributions, are not taxable to employees until withdrawn from the plan, and so that the Company’s contributions are deductible when made.
Other considerations |
The employment agreements with our named executive officers,In October 2018, Messrs. Capel, Story, Richards, and Howell, and Ms. Pinne, were amended in 2018, to eliminate, asentered into a constructive termination event,new employment agreement with the Company’s insolvency or filingCompany. The NEOs’ employment agreements are substantially identical, except for bankruptcy following a change in control, consistent with good governance practices.their job titles and their stated specific annual base salaries and bonus target amounts.
Each agreement continues to provideprovides that the named executive officerNEO will be (i) paid an annual base salary, (ii) eligible for an annual performance-based bonus, (iii) eligible for equity awards that reflect their Company position, duties, and responsibilities, (iv) eligible to participate in all other benefit plans, programs, and arrangements generally available to executives of the Company, (v) provided an indemnification agreement, under which the Company will indemnify the executive to the full extent permitted by law with respect to any claim arising out of the executive’s service as an officer, director, or employee of the Company, and (vi) covered by a director and officers liability insurance policy. As set forth in the agreements, the minimum annual base salaries of Messrs. Capel, Story, Richards, and Howell, and Ms. Pinne, are $475,000, $360,000, $283,000, $265,000,$575,000, $402,000, $320,000, $323,000, and $240,000,$252,150, respectively. Each named executive officer’sNEO’s annual base salary is subject to increases or decreases at the discretion of the Board or Compensation Committee.
Each agreement further provides that the named executive officerNEO or the Company may terminate that officer’s employment at any time. If the Company terminates the named executive officer’sNEO’s employment for reasons other than death, disability, or “cause” (as defined in the agreement) or if there is a “constructive termination” of the executive officer’s employment (as defined in the agreement), the officer will be entitled to certain severance payments and benefits. Those payments and benefits are described below in the section entitled Potential Payments upon Termination, and that section also contains an estimate of the potential payments and benefits payable under these arrangements assuming a termination as of the end of 2017.2020.
In general, severance payments to a named executive officerNEO are limited such that they will not receive any “parachute payment” as described in Sections 280G and 4999 of the Internal Revenue Code. The named executive officerNEO is required to provide the Company with a general release of all claims to receive any severance payments or benefits.
3236
The agreements contain provisions requiring the named executive officerNEO to protect the proprietary and confidential information of the Company. In addition, for a period of 12 months after termination of employment for any reason (or, if later, the last date any severance payments are due), the named executive officerNEO agrees not to solicit the Company’s customers or solicit or hire away the Company’s employees and is prohibited from performing duties of the type performed for the Company for a competing business owned by any of a designated group of companies. The named executive officerNEO also agrees to assign to the Company all patents, inventions, copyrights, and other intellectual property developed by them in the course of their employment.
Policy with Respect to Qualifying Compensation for Deductibility
For taxable years beginning before January 1, 2018, Section 162(m) of the Internal Revenue Code imposed a limit on federal income tax deductibility for annual compensation in excess of one$1 million dollars paid by a public corporation to its Chief Executive Officer and its other three most highly compensated executive officers (other than the Chief Financial Officer). Compensation in excess of one$1 million dollars could be deducted, however, if it qualified as “performance-based compensation” within the meaning of Section 162(m) or qualified for one of the other exemptions from the deductibility limit. We designed the Company’s compensation program to satisfy the exemption under Section 162(m).
Congress repealed the exemption for performance-based compensation in new tax legislation enacted December 22, 2017, effective for tax years beginning after December 31, 2017, and expanded the number of employees who will be considered “covered employees” subject to the Section 162(m) limit to include the Chief Financial Officer (who was previously excluded) and certain former named executive officers.NEOs. As a result of these changes, starting in 2018, compensation exceeding of $1 million paid to executive officers covered by Section 162(m)’s deduction limit will not beis no longer deductible in 2018 or future years unless it qualifies for transition relief applicable to certain arrangements in place as of November 2, 2017. The Compensation Committee has taken steps it deemed appropriate intending to preserve the deductibility of certain awards granted prior to enactment of the legislation. Due to uncertainties of the scope of the transition relief, however, there are no assurances that any compensation we pay to our covered employees will be or remain exempt from Section 162(m)’s deduction limit.
The Compensation Committee considers tax deductibility when making its decisions regarding executive compensation but reserves the right to award nondeductible compensation when appropriate to accomplish other compensation objectives.
Limitation of Liability and Indemnification of Officers and Directors
The Company’s Articles of Incorporation provide that the liability of the Directors to the shareholders for monetary damages will be limited to the fullest extent permissible under Georgia law. This limitation of liability does not affect the availability of injunctive relief or other equitable remedies.
The Company’s Bylaws provide that the Company will indemnify each of its officers, Directors, employees, and agents to the extent they are or were a party, or are threatened to be made a party, to any threatened, pending, or completed action, suit, or proceeding, whether civil, criminal, administrative, or investigative because they are or were a Director, officer, employee, or agent of the Company, against reasonable expenses (including attorneys’ fees), judgments, fines, and amounts paid in settlement in connection with such action, suit, or proceeding; provided, however, that no indemnification will be made for:
| ✓ | any appropriation, in violation of their duties, of any business opportunity of the Company; |
| ✓ | acts or omissions that involve intentional misconduct or a knowing violation of law; |
| ✓ | any liability under Section 14-2-832 of the Georgia Business Corporation Code, which relates to unlawful payments of dividends and unlawful stock repurchases and redemptions; or |
| ✓ | any transaction from which they derived an improper personal benefit. |
The Company has entered into indemnification agreements with its Officers and Directors providing indemnification similar to that provided in the Bylaws.
3337
Compensation Committee Report on Executive Compensation
The Compensation Committee has reviewed and discussed with management the Compensation Discussion and Analysis section of the Company’s 20182021 Proxy Statement. Based on its review and discussions with management, the Compensation Committee recommended to the Board of Directors that the Compensation Discussion and Analysis be included in the Company’s 20182021 Proxy statement (and in the Company’s Annual Report on Form 10-K through incorporation by reference to the Proxy Statement).
Compensation Committee |
|
Thomas E. Noonan, Chairman |
John J. Huntz, Jr. Charles E. Moran |
The foregoing report shall not be deemed incorporated by reference by any general statement incorporating by reference this proxy statement into any filing under the Securities Act of 1933, as amended, or under the Securities Exchange Act of 1934, as amended, except to the extent that we specifically incorporate this information by reference, and shall not otherwise be deemed filed under such Acts.
3438
The following table sets forth, for the three years ended December 31, 2017,2020, the total compensation paid to or earned by the named executive officers.
Name and Principal Position | Year | Salary | Stock Awards(1) |
| Non-Equity Incentive Plan Compensation(2) |
| All Other Compensation(3) |
| Total | Year | Salary(1) | Stock Awards(2) |
| Non-Equity Incentive Plan Compensation(3) |
| All Other Compensation(4) |
| Total | ||
|
|
|
|
|
|
|
|
|
|
|
|
|
|
|
|
|
|
|
|
|
Eddie Capel | 2017 |
| $575,000 | $2,430,742 |
| $281,750 |
| $43,845 | (4) | $3,331,337 | 2020 |
| $503,750 | $5,295,282 |
| $669,600 |
| $45,410 | (5) | $6,514,042 |
President, Chief Executive | 2016 |
| 575,000 | 2,206,398 |
| 511,750 |
| 44,252 |
| 3,337,400 | 2019 |
| 600,000 | 7,640,747 | (10) | 900,000 |
| 45,777 |
| 9,186,524 |
Officer, and Director | 2015 |
| 575,000 | 4,567,221 |
| 759,000 |
| 14,848 |
| 5,916,069 | 2018 |
| 575,000 | 3,237,708 |
| 632,501 |
| 41,314 |
| 4,486,523 |
|
|
|
|
|
|
|
|
|
|
|
|
|
|
|
|
|
|
|
|
|
Dennis B. Story | 2017 |
| $391,167 | $875,085 |
| $140,140 |
| $21,856 | (5) | $1,428,248 | 2020 |
| $380,738 | $1,613,868 |
| $345,600 |
| $30,822 | (6) | $2,371,028 |
Executive Vice President, Chief | 2016 |
| 350,167 | 5,029,828 |
| 227,140 |
| 21,706 |
| 5,628,841 | 2019 |
| 415,000 | 4,121,992 | (10) | 465,000 |
| 31,588 |
| 5,033,580 |
Financial Officer, and Treasurer | 2015 |
| 382,000 | 1,868,424 |
| 366,960 |
| 21,685 |
| 2,639,069 | 2018 |
| 401,167 | 1,593,966 |
| 325,600 |
| 21,352 |
| 2,342,085 |
|
|
|
|
|
|
|
|
|
|
|
|
|
|
|
|
|
|
|
|
|
Bruce S. Richards | 2017 |
| $309,167 | $437,568 |
| $87,710 |
| $18,826 | (6) | $853,271 | 2020 |
| $338,000 | $585,056 |
| $211,680 |
| $28,808 | (7) | $1,163,544 |
Senior Vice President, Chief | 2016 |
| 300,000 | 451,258 |
| 153,970 |
| 22,707 |
| 927,935 | 2019 |
| 328,000 | 1,186,330 | (10) | 285,000 |
| 18,350 |
| 1,817,680 |
Legal Officer, and Secretary | 2015 |
| 300,000 | 730,130 |
| 228,360 |
| 25,278 |
| 1,283,768 | 2018 |
| 319,167 | 577,820 |
| 202,400 |
| 18,141 |
| 1,117,528 |
|
|
|
|
|
|
|
|
|
|
|
|
|
|
|
|
|
|
|
|
|
Robert G. Howell | 2017 |
| $308,250 | $875,085 |
| $147,000 |
| $30,902 | (7) | $1,361,237 | 2020 |
| $344,000 | $1,260,832 |
| $367,200 |
| $30,366 | (8) | $2,002,398 |
Senior Vice President, | 2016 |
| 289,000 | 702,056 |
| 257,210 |
| 25,222 |
| 1,273,488 | 2019 |
| 333,000 | 3,267,444 | (10) | 495,000 |
| 31,133 |
| 4,126,577 |
Americas Sales | 2015 |
| 289,000 | 2,191,015 |
| 381,480 |
| 23,868 |
| 2,885,363 | 2018 |
| 321,917 | 1,245,252 |
| 343,200 |
| 27,301 |
| 1,937,670 |
|
|
|
|
|
|
|
|
|
|
|
|
|
|
|
|
|
|
|
|
|
Linda C. Pinne | 2017 |
| $245,750 | $121,553 |
| $40,261 |
| $8,100 | (8) | $415,664 | 2020 |
| $263,345 | $211,822 |
| $99,544 |
| $3,819 | (9) | $578,530 |
Senior Vice President, Global Corporate | 2016 |
| 239,792 | 125,344 |
| 71,200 |
| 7,950 |
| 444,286 | 2019 |
| 259,715 | 502,672 | (10) | 130,118 |
| 8,400 |
| 900,905 |
Controller, and Chief Accounting Officer |
|
|
|
|
|
|
|
|
|
| ||||||||||
|
|
|
|
|
|
|
|
|
|
| ||||||||||
Controller, and Chief Accounting | 2018 |
| 251,638 | 159,386 |
| 92,692 |
| 8,250 |
| 511,966 | ||||||||||
Officer |
|
|
|
|
|
|
|
|
|
| ||||||||||
______________
| (1) | The Company reduced the base salary of our NEOs to position the Company for uncertainty in the near-term caused by the COVID-19 pandemic. Effective April 1, 2020, our Board reduced the base salary of our EVP and CFO by 15% and those of our remaining NEOs by 10%, for the remainder of 2020. In December 2020, our Board approved repayment of our NEOs’ salary reductions, except for our CEO and CFO. The Company repaid those reductions in January 2021. The 2020 salary amounts for Messrs. Richards, Howell and Ms. Pinne include the salary reinstatement. The salary amounts shown for Messrs. Capel and Story reflect salary reductions implemented in response to the Covid-19 pandemic. |
(2) | The amounts in this column represent the aggregate grant date fair value for the stock awards (service-based and performance-based RSUs) granted in accordance with |
|
| Represent amounts earned in the applicable year, regardless of whether we paid those amounts prior to the end of such year. |
|
| The amounts in this column represent the Section 401(k) matching or similar Company contribution, tax “gross-up” payments on behalf of |
|
| This amount represents: (i) the Company’s contributions to Mr. Capel’s account under its Section 401(k) plan in the amount of |
|
| This amount represents: (i) the Company’s contributions to Mr. Story’s account under its Section 401(k) plan in the amount of |
|
| This amount represents: (i) the Company’s contributions to Mr. Richards’s account under its Section 401(k) plan in the amount of |
|
| This amount represents: (i) the Company’s contributions to Mr. Howell’s account under its Section 401(k) plan in the amount of |
|
| This amount represents the Company’s contributions to Ms. Pinne’s account under its Section 401(k) plan in the amount of |
|
|
|
3539
20172020 Grants of Plan-Based Awards Table
The following table provides information about our 20172020 annual cash bonus opportunities and the equity awards granted to our named executive officers during the year ended December 31, 2017.2020.
Plan-Based Compensation | Plan-Based Compensation | Plan-Based Compensation | ||||||||||||||||||||||||||||||||
|
|
|
|
|
| Estimated Future Payouts Under Non-Equity Incentive Plan Awards(1) |
| Estimated Future Payouts Under Equity Incentive Plan Awards(2) |
| All Other Stock Awards: Number of Stock |
| Grant Date Fair Value of Stock |
|
|
|
|
|
| Estimated Future Payouts Under Non-Equity Incentive Plan Awards(1) |
| Estimated Future Payouts Under Equity Incentive Plan Awards(2) |
| All Other Stock Awards: Number of Stock |
| Grant Date Fair Value of Stock |
| ||||||||
Name |
| Award Type |
| Grant Date |
| Target ($) |
| Maximum ($) |
| Target (#) |
| Maximum (#) |
| Units(3) (#) |
| Awards(4) ($) |
|
| Award Type |
| Grant Date |
| Target ($) |
| Maximum ($) |
| Target (#) |
| Maximum (#) |
| Units(3) (#) |
| Awards(4) ($) |
|
Eddie Capel |
| Cash Bonus |
| 1/26/2017 |
| 575,000 |
| 862,500 |
| - |
| - |
| - |
| - |
|
| Cash Bonus |
| 1/31/2020 |
| 620,000 |
| 930,000 |
| - |
| - |
| - |
| - |
|
|
| Service-based RSUs |
| 1/26/2017 |
| - |
| - |
| - |
| - |
| 23,887 |
| 1,215,371 |
|
| Service-based RSUs |
| 1/31/2020 |
| - |
| - |
| - |
| - |
| 30,148 |
| 2,647,597 |
|
|
| Performance-based RSUs |
| 1/26/2017 |
| - |
| - |
| 23,887 |
| 35,831 |
| - |
| 1,215,371 |
|
| Performance-based RSUs |
| 1/31/2020 |
| - |
| - |
| 30,149 |
| 45,224 |
| - |
| 2,647,685 |
|
|
|
|
|
|
|
|
|
|
|
|
|
|
|
|
|
|
|
|
|
|
|
|
|
|
|
|
|
|
|
|
|
|
|
|
Dennis B. Story |
| Cash Bonus |
| 1/26/2017 |
| 286,000 |
| 429,000 |
| - |
| - |
| - |
| - |
|
| Cash Bonus |
| 1/31/2020 |
| 320,000 |
| 480,000 |
| - |
| - |
| - |
| - |
|
|
| Service-based RSUs |
| 1/26/2017 |
| - | �� | - |
| - |
| - |
| 8,599 |
| 437,517 |
|
| Service-based RSUs |
| 1/31/2020 |
| - |
| - |
| - |
| - |
| 9,188 |
| 806,890 |
|
|
| Performance-based RSUs |
| 1/26/2017 |
| - |
| - |
| 8,600 |
| 12,900 |
| - |
| 437,568 |
|
| Performance-based RSUs |
| 1/31/2020 |
| - |
| - |
| 9,189 |
| 13,784 |
| - |
| 806,978 |
|
|
|
|
|
|
|
|
|
|
|
|
|
|
|
|
|
|
|
|
|
|
|
|
|
|
|
|
|
|
|
|
|
|
|
|
Bruce S. Richards |
| Cash Bonus |
| 1/26/2017 |
| 179,000 |
| 268,500 |
| - |
| - |
| - |
| - |
|
| Cash Bonus |
| 1/31/2020 |
| 196,000 |
| 294,000 |
| - |
| - |
| - |
| - |
|
|
| Service-based RSUs |
| 1/26/2017 |
| - |
| - |
| - |
| - |
| 4,300 |
| 218,784 |
|
| Service-based RSUs |
| 1/31/2020 |
| - |
| - |
| - |
| - |
| 3,331 |
| 292,528 |
|
|
| Performance-based RSUs |
| 1/26/2017 |
| - |
| - |
| 4,300 |
| 6,450 |
| - |
| 218,784 |
|
| Performance-based RSUs |
| 1/31/2020 |
| - |
| - |
| 3,331 |
| 4,997 |
| - |
| 292,528 |
|
|
|
|
|
|
|
|
|
|
|
|
|
|
|
|
|
|
|
|
|
|
|
|
|
|
|
|
|
|
|
|
|
|
|
|
Robert G. Howell |
| Cash Bonus |
| 1/26/2017 |
| 300,000 |
| 450,000 |
| - |
| - |
| - |
| - |
|
| Cash Bonus |
| 1/31/2020 |
| 340,000 |
| 510,000 |
| - |
| - |
| - |
| - |
|
|
| Service-based RSUs |
| 1/26/2017 |
| - |
| - |
| - |
| - |
| 8,599 |
| 437,517 |
|
| Service-based RSUs |
| 1/31/2020 |
| - |
| - |
| - |
| - |
| 7,178 |
| 630,372 |
|
|
| Performance-based RSUs |
| 1/26/2017 |
| - |
| - |
| 8,600 |
| 12,900 |
| - |
| 437,568 |
|
| Performance-based RSUs |
| 1/31/2020 |
| - |
| - |
| 7,179 |
| 10,769 |
| - |
| 630,460 |
|
|
|
|
|
|
|
|
|
|
|
|
|
|
|
|
|
|
|
|
|
|
|
|
|
|
|
|
|
|
|
|
|
|
|
|
Linda C. Pinne |
| Cash Bonus |
| 1/26/2017 |
| 82,164 |
| 123,246 |
| - |
| - |
| - |
| - |
|
| Cash Bonus |
| 1/31/2020 |
| 92,170 |
| 138,255 |
| - |
| - |
| - |
| - |
|
|
| Service-based RSUs |
| 1/26/2017 |
| - |
| - |
| - |
| - |
| 1,194 |
| 60,751 |
|
| Service-based RSUs |
| 1/31/2020 |
| - |
| - |
| - |
| - |
| 1,206 |
| 105,911 |
|
|
| Performance-based RSUs |
| 1/26/2017 |
| - |
| - |
| 1,195 |
| 1,793 |
| - |
| 60,802 |
|
| Performance-based RSUs |
| 1/31/2020 |
| - |
| - |
| 1,206 |
| 1,809 |
| - |
| 105,911 |
|
_________________
(1) | These columns represent the target and maximum annual cash bonus opportunities under the Company’s annual cash bonus program for |
As our financial performance in 2017 was below the minimum threshold, the named executive officers did not earn any of the granted performance-based RSUs awarded.
(3) | This column represents service-based RSU awards granted to the |
(4) | This column represents the aggregate grant date fair value for performance-based and service-based RSU awards in accordance with ASC Topic 718. We determined these fair values based on the closing market price of the Company’s Common Stock on the date of grant. |
3640
20172020 Outstanding Equity AwardsAwards at Fiscal Year-End Table
The following table summarizes the equity awards of our named executive officers outstanding as of December 31, 2017.2020. We determined the market value of unvested stock awards based on the closing market price for our Common Stock of $49.54$105.18 per share on December 31, 2017.2020.
Outstanding Equity Awards at Fiscal Year End | Outstanding Equity Awards at Fiscal Year End |
| Outstanding Equity Awards at Fiscal Year End |
| ||||||||||||||||
|
|
|
| Stock Awards (1) |
|
|
|
| Stock Awards (1) |
| ||||||||||
Name |
| Grant Date |
| Number of Shares or Stock Units That Have Not Vested (#) |
|
| Market Value of Shares or Stock Units That Have Not Vested ($) |
|
| Grant Date |
| Number of Shares or Stock Units That Have Not Vested (#) |
|
| Market Value of Shares or Stock Units That Have Not Vested ($) |
| ||||
|
|
|
|
|
|
|
|
|
|
|
|
|
|
|
|
|
|
|
|
|
Eddie Capel |
| 1/23/2013 |
|
| 31,280 |
|
| $ | 1,549,611 |
|
| 1/26/2017 |
|
| 5,972 |
|
|
| 628,135 |
|
|
| 1/30/2014 |
|
| 9,959 |
|
|
| 493,369 |
|
| 2/1/2018 |
|
| 32,305 |
|
|
| 3,397,840 |
|
|
| 1/29/2015 |
|
| 14,258 |
|
|
| 706,341 |
|
| 1/31/2019 |
|
| 46,383 |
| (2) |
| 4,878,564 |
|
|
| 7/27/2015 |
|
| 39,839 |
|
|
| 1,973,624 |
|
| 1/31/2019 |
|
| 98,565 |
|
|
| 10,367,067 |
|
|
| 1/28/2016 |
|
| 26,508 |
|
|
| 1,313,206 |
|
| 1/30/2020 |
|
| 62,709 |
| (3) |
| 6,595,733 |
|
|
| 1/26/2017 |
|
| 23,887 |
| (2) |
| 1,183,362 |
|
|
|
|
|
|
|
|
|
|
|
Dennis B. Story |
| 1/26/2017 |
|
| 2,150 |
|
|
| 226,137 |
| ||||||||||
|
|
|
|
|
|
|
|
|
|
|
| 2/1/2018 |
|
| 15,904 |
|
|
| 1,672,783 |
|
Dennis B. Story |
| 8/1/2016 |
|
| 52,500 |
|
|
| 2,600,850 |
| ||||||||||
|
| 1/31/2019 |
|
| 46,383 |
| (2) |
| 4,878,564 |
| ||||||||||
|
| 1/31/2019 |
|
| 30,923 |
|
|
| 3,252,481 |
| ||||||||||
|
| 1/26/2017 |
|
| 8,599 |
| (2) |
| 425,994 |
|
| 1/30/2020 |
|
| 19,113 |
| (3) |
| 2,010,305 |
|
|
|
|
|
|
|
|
|
|
|
|
|
|
|
|
|
|
|
|
|
|
Bruce S. Richards |
| 1/30/2014 |
|
| 2,989 |
|
|
| 148,075 |
|
| 1/26/2017 |
|
| 1,075 |
|
|
| 113,069 |
|
|
| 1/29/2015 |
|
| 4,213 |
|
|
| 208,712 |
|
| 2/1/2018 |
|
| 5,766 |
|
|
| 606,468 |
|
|
| 7/27/2015 |
|
| 4,620 |
|
|
| 228,875 |
|
| 1/31/2019 |
|
| 11,133 |
| (2) |
| 1,170,969 |
|
|
| 1/28/2016 |
|
| 5,422 |
|
|
| 268,606 |
|
| 1/31/2019 |
|
| 11,210 |
|
|
| 1,179,068 |
|
|
| 1/26/2017 |
|
| 4,300 |
| (2) |
| 213,022 |
|
| 1/30/2020 |
|
| 6,929 |
| (3) |
| 728,792 |
|
|
|
|
|
|
|
|
|
|
|
|
|
|
|
|
|
|
|
|
|
|
Robert G. Howell |
| 1/23/2013 |
|
| 3,519 |
|
|
| 174,331 |
|
| 1/26/2017 |
|
| 2,150 |
|
|
| 226,137 |
|
|
| 1/30/2014 |
|
| 3,321 |
|
|
| 164,522 |
|
| 2/1/2018 |
|
| 12,425 |
|
|
| 1,306,862 |
|
|
| 1/29/2015 |
|
| 5,833 |
|
|
| 288,967 |
|
| 1/31/2019 |
|
| 37,107 |
| (2) |
| 3,902,914 |
|
|
| 7/27/2015 |
|
| 20,023 |
|
|
| 991,939 |
|
| 1/31/2019 |
|
| 24,158 |
|
|
| 2,540,938 |
|
|
| 1/28/2016 |
|
| 8,436 |
|
|
| 417,919 |
|
| 1/30/2020 |
|
| 14,932 |
| (3) |
| 1,570,548 |
|
|
| 1/26/2017 |
|
| 8,599 |
| (2) |
| 425,994 |
|
|
|
|
|
|
|
|
|
|
|
|
|
|
|
|
|
|
|
|
|
| ||||||||||
Linda C. Pinne |
| 1/30/2014 |
|
| 665 |
|
|
| 32,944 |
|
| 1/26/2017 |
|
| 299 |
|
|
| 31,449 |
|
|
| 1/29/2015 |
|
| 1,167 |
|
|
| 57,813 |
|
| 2/1/2018 |
|
| 1,592 |
|
|
| 167,447 |
|
|
| 7/27/2015 |
|
| 2,887 |
|
|
| 143,022 |
|
| 1/31/2019 |
|
| 5,566 |
| (2) |
| 585,432 |
|
|
| 1/28/2016 |
|
| 1,506 |
|
|
| 74,607 |
|
| 1/31/2019 |
|
| 3,867 |
|
|
| 406,731 |
|
|
| 1/26/2017 |
|
| 1,194 |
| (2) |
| 59,151 |
|
| 1/30/2020 |
|
| 2,509 |
| (3) |
| 263,897 |
|
_________________
(1) | RSU awards vest in accordance with the schedules set forth below. |
(2) |
|
(3) | These amounts represent, as of December 31, |
3741
Stock Awards Vesting Schedule | ||||
| Grant Date |
| Vesting | |
|
|
|
|
|
Eddie Capel |
| 1/ |
| 25% per year for 4 years |
|
| 2/1/ |
| 25% per year for 4 years |
|
| 1/ |
| |
|
| |||
|
| 25% per year for 4 years | ||
|
| 1/ | 10% in Jan. 2020; 20% in Jan. 2021; 30% in Jan. 2022; 40% in Jan. 2023 | |
1/30/2020 |
| 25% per year for 4 years | ||
|
|
|
|
|
Dennis B. Story |
|
|
| 25% |
2/1/2018 | 25% | |||
|
| 1/ | 25% per year for 4 years | |
1/31/2019 | 10% in Jan. 2020; 20% in Jan. 2021; 30% in Jan. 2022; 40% in Jan. 2023 | |||
1/30/2020 |
| 25% per year for 4 years | ||
|
|
|
|
|
Bruce S. Richards |
| 1/ | 25% per year for 4 years | |
2/1/2018 |
| 25% per year for 4 years | ||
|
| 1/ |
| |
|
| |||
|
| 25% per year for 4 years | ||
|
| 1/ | 10% in Jan. 2020; 20% in Jan. 2021; 30% in Jan. 2022; 40% in Jan. 2023 | |
1/30/2020 |
| 25% per year for 4 years | ||
|
|
|
|
|
Robert G. Howell |
| 1/ |
| 25% per year for 4 years |
|
| 2/1/ |
| 25% per year for 4 years |
|
| 1/ |
| |
|
| |||
|
| 25% per year for 4 years | ||
|
| 1/ | 10% in Jan. 2020; 20% in Jan. 2021; 30% in Jan. 2022; 40% in Jan. 2023 | |
1/30/2020 |
| 25% per year for 4 years | ||
|
|
|
|
|
Linda C. Pinne |
| 1/ | 25% per year for 4 years | |
2/1/2018 |
| 25% per year for 4 years | ||
|
| 1/ |
| |
|
| |||
|
| 25% per year for 4 years | ||
|
| 1/ | 10% in Jan. 2020; 20% in Jan. 2021; 30% in Jan. 2022; 40% in Jan. 2023 | |
1/30/2020 |
| 25% per year for 4 years | ||
|
|
|
|
|
20172020 Stock Vested Table
The following table provides information about the value realized by the named executive officers from their stock awards that vested during the year ended December 31, 2017.2020.
Stock Vested | Stock Vested | Stock Vested | ||||||
|
| Stock Awards |
| Stock Awards | ||||
|
| Number of |
| Value |
| Number of |
| Value |
|
| Shares Acquired |
| Realized on |
| Shares Acquired |
| Realized on |
Name |
| on Vesting |
| Vesting |
| on Vesting |
| Vesting |
Eddie Capel |
| 82,715 |
| $4,211,981 |
| 122,628 |
| $10,208,540 |
Dennis B. Story |
| 17,500 |
| 897,050 |
| 45,094 |
| 3,745,074 |
Bruce S. Richards |
| 12,791 |
| 651,451 |
| 17,009 |
| 1,422,943 |
Robert G. Howell |
| 20,219 |
| 1,028,862 |
| 50,220 |
| 4,247,342 |
Linda C. Pinne |
| 2,997 |
| 152,497 |
| 7,381 |
| 623,004 |
3842
Potential Payments upon Termination of Employment
Each named executive officer’sNEO’s employment agreement provides that, if the Company terminates that officer’s employment for reasons other than death, disability, or “cause” (as defined in the agreement), or if the officer terminates their employment for “constructive termination” (as defined in the agreement), then the officer will be entitled to certain severance payments and benefits. Those payments and benefits are described in footnote 1 to the following table, except that if the termination occurs within two years following a change in control of the Company (as defined in the agreement), those payments and benefits are as described in footnote 2 to the table. The following table shows the estimated amounts that would have been payable to our named executive officersNEOs under their employment agreements if their termination of employment was effective as of December 31, 2017.2020.
| Cash Severance |
|
| Value of Accelerated Stock Vesting |
|
| Health Benefits |
|
| Cash Severance |
| Value of Accelerated Stock Vesting |
| Health Benefits |
| |||
Eddie Capel |
|
|
|
|
|
|
|
|
|
|
|
|
|
|
|
|
|
|
Termination without cause or constructive termination(1) | $ | 575,000 |
|
| $ | - |
|
| $ | 38,404 |
|
| ||||||
Change in control with termination without cause or constructive termination(2) |
| 1,443,250 |
|
|
| 8,402,876 |
|
|
| 38,404 |
|
| ||||||
Termination without cause or constructive termination(1) | $620,000 |
| - |
| $39,055 |
| ||||||||||||
Change in control with termination without cause or constructive termination(2) | 1,475,600 |
| 25,613,644 |
| 39,055 |
| ||||||||||||
|
|
|
|
|
|
|
|
|
|
|
|
|
|
|
|
|
|
|
Dennis B. Story |
|
|
|
|
|
|
|
|
|
|
|
|
|
|
|
|
|
|
Termination without cause or constructive termination(1) |
| 392,000 |
|
|
| - |
|
|
| 38,404 |
|
| ||||||
Change in control with termination without cause or constructive termination(2) |
| 823,860 |
|
|
| 3,452,888 |
|
|
| 38,404 |
|
| ||||||
Termination without cause or constructive termination(1) | 429,000 |
| - |
| 39,055 |
| ||||||||||||
Change in control with termination without cause or constructive termination(2) | 870,600 |
| 11,962,858 |
| 39,055 |
| ||||||||||||
|
|
|
|
|
|
|
|
|
|
|
|
|
|
|
|
|
|
|
Bruce S. Richards |
|
|
|
|
|
|
|
|
|
|
|
|
|
|
|
|
|
|
Termination without cause or constructive termination(1) |
| 310,000 |
|
|
| - |
|
|
| 38,404 |
|
| ||||||
Change in control with termination without cause or constructive termination(2) |
| 580,290 |
|
|
| 1,280,312 |
|
|
| 38,404 |
|
| ||||||
Termination without cause or constructive termination(1) | 338,000 |
| - |
| 39,055 |
| ||||||||||||
Change in control with termination without cause or constructive termination(2) | 608,480 |
| 3,770,282 |
| 39,055 |
| ||||||||||||
|
|
|
|
|
|
|
|
|
|
|
|
|
|
|
|
|
|
|
Robert G. Howell |
|
|
|
|
|
|
|
|
|
|
|
|
|
|
|
|
|
|
Termination without cause or constructive termination(1) |
| 310,000 |
|
|
| - |
|
|
| 38,404 |
|
| ||||||
Change in control with termination without cause or constructive termination(2) |
| 763,000 |
|
|
| 2,889,718 |
|
|
| 38,404 |
|
| ||||||
Termination without cause or constructive termination(1) | 344,000 |
| - |
| 39,055 |
| ||||||||||||
Change in control with termination without cause or constructive termination(2) | 813,200 |
| 9,486,920 |
| 39,055 |
| ||||||||||||
|
|
|
|
|
|
|
|
|
|
|
|
|
|
|
|
|
|
|
Linda C. Pinne |
|
|
|
|
|
|
|
|
|
|
|
|
|
|
|
|
|
|
Termination without cause or constructive termination(1) |
| 246,000 |
|
|
| - |
|
|
| 38,404 |
|
| ||||||
Change in control with termination without cause or constructive termination(2) |
| 370,067 |
|
|
| 426,738 |
|
|
| 38,404 |
|
| ||||||
Termination without cause or constructive termination(1) | 263,345 |
| - |
| 39,055 |
| ||||||||||||
Change in control with termination without cause or constructive termination(2) | 390,539 |
| 1,444,752 |
| 39,055 |
| ||||||||||||
|
|
|
|
|
|
|
|
|
|
|
|
|
|
|
|
|
|
|
_________________
(1) | The employment agreement for each |
(2) | The employment agreement for each |
Compensation Committee Interlocks and Insider Participation
The following non-employee Directors were the members ofserved on the Compensation Committee of the Board of Directors during 2017:all or a portion of 2020: Thomas E. Noonan (Chairman), Edmond I. Eger III, and John J. Huntz, Jr., and Charles E. Moran. To the Company’s knowledge, there were no interlocking relationships involving members of the Compensation Committee or other Directors requiring disclosure in this Proxy Statement.
3943
As required by Section 953(b) of the Dodd-Frank Wall Street Reform and Consumer Protection Act, and Item 402(u) of Regulation S-K, we provide the following information about the relationship of the annual total compensation of Eddie Capel, our Chief Executive Officer (our “CEO”), to the median annual total compensation of our employees:
Our CEO to Median Employee pay ratio is approximately 39:70:1. We believe this is a reasonable estimate based on the assumptions and adjustments described below.
We identified our employee with compensation at the median annual total compensation of all our employees (our “Median Employee”) by examining the total cash compensation during the calendar year 20172020 (using December 31, 2017,2020, as the “median employee determination date”), including salary or wages (including overtime), and any cash incentive compensation, paid in 2017,2020, plus the value of any equity vesting during 20172020 under our stock incentive plan, for each employee, excluding our CEO, whom we employed (including those of our consolidated subsidiaries) on December 31, 2017,2020, whether on a full-time, part-time, seasonal, or temporary basis (excluding nine Chilean employees as described below).basis.
For employees paid other than in U.S. dollars, we converted their compensation to U.S. dollars using the Internal Revenue Service Yearly Average Currency Exchange Rates.Rates, or the U.S. Department of the Treasury Reporting Rates of Exchange. For non-U.S. employees, we made cost-of-living adjustments using the applicable World Bank Price Level Ratio of Purchasing Power Parity Conversion Factor. For employees hired during 2017,2020, we calculated their salary or wages as if they had been employed for all of 2017.2020.
Our total number of employees on December 31, 2017,2020, including U.S. and non-U.S. employees, was approximately 2,784. In identifying our Median Employee, as permitted by3,400. We did not utilize the de minimus exemption we excluded from our employee population nine Chilean employees. That exemption allows us to exclude certainany non-U.S. employees not to exceed five percent of our total employee population.employees.
After identifying our Median Employee, which was a U.S.an employee based in India, we calculated their annual total compensation using our method for calculating our CEO’s compensation reported in the “Total” column of our 20172020 Summary Compensation Table.
As disclosed in our 20172020 Summary Compensation Table, our CEO’s annual total compensation for 20172020 was $3,331,337.$6,514,042.
Our Median Employee’s computed annual total compensation for 20172020 was $85,992.$93,605. For purposes of this disclosure, we applied an Australian dollars (“AUD”) to U.S. dollars (“USD”) exchange rate conversion using the Internal Revenue Service 2020 Yearly Average Currency Exchange Rate of AUD 1.452 to USD 1.00 to the compensation elements paid in Australian currency. The resulting ratio of our CEO’s annual total compensation to that of our Median Employee for 20172020 is approximately 39:70:1.
Had we not made any cost-of-living adjustments, our Median Employee would have been a lower compensated U.S.Australian employee with ana computed annual total compensation for 20172020 of $72,819.$70,705. The resulting ratio of our CEO’s annual total compensation to that of our Median Employee for 20172020 would have been approximately 46:92:1.
Executive OfficersOfficer Biographies
In addition to Eddie Capel, whose biography can be found on page 12,14, the following individuals serve as our executive officers:
Dennis B. Story, age 54,57, has served as our Executive Vice President, Chief Financial Officer, and Treasurer since July 31, 2016, and from January 12, 2011 through June 30, 2016. From July 1, 2016 through July 25, 2016, he served as Chief Financial Officer of BenefitFocus, Inc. Previously, Mr. Story served as our Senior Vice President, Chief Financial Officer, and Treasurer from joining the Company in March 2006 through January 2011. From February 2006 until he joined the Company, Mr. Story served as the Senior Vice President of Finance for Fidelity National Information Services, Inc. Prior to that, Mr. Story was the Senior Vice President of Finance for Certegy Inc., a financial services company, from 2004 until its merger with Fidelity National Information Services, Inc., in February 2006. Prior to his association with Certegy, Mr. Story served as Chief Financial Officer of NewRoads Inc., a provider of outsourced solutions for fulfillment and customer care to companies engaged in one-to-one direct commerce, from September 2003 to September 2004, and Senior Vice President and Corporate Controller of credit reporting company Equifax Inc., from December 2000 until August 2003.
Bruce S. Richards, age 63,66, has served as our Senior Vice President, Chief Legal Officer, and Secretary since August 2011. Prior to that, Mr. Richards was a partner in the Atlanta-based law firm Taylor English Duma LLP, where he practiced as a member of the firm’s corporate and business law department since 2005. In 2007, while at Taylor English Duma, Mr. Richards also served as interim general counsel for Witness Systems, Inc. Before joining Taylor English Duma, Mr. Richards served in various corporate legal positions, including serving as Corporate Vice President, General Counsel, and Secretary of Certegy Inc., a financial services company, from 2001 through 2002, following Certegy’s spinoff from credit reporting company Equifax Inc., Corporate Vice President
4044
and General Counsel of Equifax Inc., from 1996 through 2000, and Vice President and General Counsel of financial services company Telecredit, Inc., from 1989 through 1990, prior to its sale to Equifax.
Robert G. Howell, age 45,48, has served as our Senior Vice President, Americas Sales since May 2013. Prior to that, Mr. Howell served as our Senior Vice President, North America Sales since January 2013, our Vice President North America Sales since January 2010, and a Senior Director of Sales since January 2009. Before that, Mr. Howell served as Director of Sales since October 2006. Prior to joining the Company, Mr. Howell served in various sales executive roles at Logility, Inc., a provider of collaborative supply chain planning solutions and a wholly owned subsidiary of American Software, Inc., from 2000 until 2006. From 1995 to 2000, he was an Account Executive with Measurex, Inc., a provider of computer process control software and scanning sensors primarily for the pulp and paper industry that was acquired by Honeywell International.
Linda C. Pinne, age 44,47, has served as our Senior Vice President, Global Corporate Controller, and Chief Accounting Officer since January 2016, when the Board also appointed her as an executive officer. Previously, Ms. Pinne served as our Vice President, Corporate Controller since January 2007 and our Controller-Americas since July 2005. Prior to joining the Company, Ms. Pinne served as Vice President of Finance for InterCept Payment Solutions, the payment processing division of InterCept, Inc., a publicly traded financial services company, from 2002 to 2005. Prior to that, Ms. Pinne was an audit manager with Arthur Andersen.
4145
Proposal 3 - Ratification of Appointment of Independent registered public accounting firm
In February 2018,January 2021, the Audit Committee of our Board appointed Ernst & Young LLP to serve as the Company’s independent registered public accounting firm for the fiscal year ending December 31, 2018.2021. If shareholders do not ratify the appointment of Ernst & Young LLP as our independent registered public accounting firm for 2018,2021, the Audit Committee will review its future selection of the independent registered public accounting firm. In addition, the Audit Committee, at its discretion, may direct the appointment of a different independent registered public accounting firm at any time during the year if the Audit Committee believes that a change would be in our best interests and the best interests of our shareholders. A proposal to ratify the appointment will be presented at the Annual Meeting. Representatives of Ernst & Young LLP are expected to be present at the Annual Meeting. They will have an opportunity to make a statement if they desire to do so and will be available to respond to appropriate questions from shareholders.
Audit and Non-Audit Fees
The following table presents the aggregate fees for professional services rendered by Ernst & Young LLP for each of the last two fiscal years.
|
| 2017 |
|
| 2016 |
|
| 2020 |
|
| 2019 |
| ||||
|
| (in thousands) |
|
| (in thousands) |
| ||||||||||
Audit Fees (1) |
| $ | 1,345 |
|
| $ | 1,219 |
|
| $ | 1,228 |
|
| $ | 1,276 |
|
Tax Fees (2) |
|
| 121 |
|
|
| 372 |
| ||||||||
All Other Fees (3) |
|
| 2 |
|
|
| 2 |
| ||||||||
Audit-Related Fees(2) |
|
| 20 |
|
|
| - |
| ||||||||
Tax Fees (3) |
|
| 172 |
|
|
| 193 |
| ||||||||
All Other Fees (4) |
|
| 2 |
|
|
| 2 |
| ||||||||
Total Fees |
| $ | 1,468 |
|
| $ | 1,593 |
|
| $ | 1,422 |
|
| $ | 1,471 |
|
__________
(1) | Audit fees consisted of charges principally associated with the annual financial statementaudit and the audit of internal control over financial reporting, the review of the Company’s quarterly reports on Form 10-Q and statutory audits required internationally. |
(2) | Audit-related fees consisted of charges principally associated with the consent on the entity’s S-8 filing dated May 19, 2020. |
(3) | Tax fees consisted of charges principally related to services associated with tax compliance, tax planning and tax advice. |
| All other fees include charges for products and/or services other than those described above. |
The Audit Committee has determined that the provision of non-audit services by Ernst & Young LLP is compatible with maintaining the independence of Ernst & Young LLP.
✓ | THE BOARD OF DIRECTORS UNANIMOUSLY RECOMMENDS A VOTE “FOR” RATIFICATION OF THE APPOINTMENT OF ERNST & YOUNG LLP AS OUR INDEPENDENT REGISTERED PUBLIC ACCOUNTING FIRM FOR THE YEAR ENDING DECEMBER 31, |
|
The Audit Committee is directly responsible for the appointment, compensation, and oversight of the Company’s independent registered public accounting firm. In this regard, the Audit Committee pre-approves all audit services and non-audit services to be provided to the Company by its independent registered public accounting firm. The Audit Committee may delegate to one or more of its members the authority to grant the approvals. The decision of any member to whom authority is delegated to approve services to be performed by the Company’s independent registered public accounting firm is presented to the full Audit Committee at its next scheduled meeting. The Audit Committee may not approve any service that individually or in the aggregate may impair, in the Audit Committee’s opinion, the independence of the independent registered public accounting firm.
The Audit Committee currently consists of Messrs. Huntz (Chairman), Heyman,Eger, and Noonan, all of whom meet the independence requirements of The Nasdaq Stock Market. The Audit Committee operates pursuant to a written charter adopted by the Board, the complete text of which is available in its current form in the Investor Relations section of our web site at www.manh.com.
In overseeing the preparation of the Company’s financial statements, the Audit Committee met with both management and the Company’s independent registered public accounting firm, Ernst & Young, LLP (“Ernst &Young”), to review and discuss the
46
financial statements prior to their issuance and to discuss significant accounting issues. Management advised the Audit Committee that
42
all financial statements were prepared in accordance with generally accepted accounting principles, and the Audit Committee discussed the statements with both management and Ernst & Young. The Audit Committee’s review included discussion with Ernst & Young of matters required to be discussed underby the rules adopted byapplicable requirements of the Public Company Accounting Oversight Board (the “PCAOB”). and the SEC. Ernst & Young has provided to the Audit Committee the written disclosures and letter to the Audit Committee required by applicable requirements of the PCAOB regarding their communications with the Audit Committee concerning independence, and the Audit Committee has discussed with Ernst & Young that firm’s independence. The Audit Committee has concluded that Ernst & Young’s provision of audit and non-audit services to the Company is compatible with Ernst & Young’s independence.
The Audit Committee has reviewed and discussed with management its assessment and report on the effectiveness of the Company’s internal control over financial reporting as of December 31, 2017,2020, which it made using the criteria set forth by the Committee of Sponsoring Organizations of the Treadway Commission in Internal Control – Integrated Framework. The Audit Committee has also reviewed and discussed with Ernst & Young its review and report on the Company’s internal control over financial reporting. The Company published these reports in its Annual Report on Form 10-K for the year ended December 31, 2017.2020.
Based on these reviews and discussions, the Audit Committee recommended to the Board that the Company’s audited financial statements be included in the Company’s Annual Report on Form 10-K for the fiscal year ended December 31, 2017.2020.
Audit Committee |
|
John J. Huntz, Jr., Chairman |
|
Thomas E. Noonan |
The foregoing report shall not be deemed incorporated by reference by any general statement incorporating by reference this proxy statement into any filing under the Securities Act of 1933, as amended, or under the Securities Exchange Act of 1934, as amended, except to the extent that we specifically incorporate this information by reference, and shall not otherwise be deemed filed under such Acts.
4347
Information About The Annual Meeting of Stockholders
Revocation
Any shareholder who submits a proxy may revoke it at any time before they vote it is voted at the Annual Meeting by providing written notice of revocation to the Company’s Secretary, by filing with the Company’s Secretary a proxy bearing a later date, or by voting in person at the Annual Meeting. Any shareholder who attends the annual meeting in person will not be considered to have revoked their proxy unless they affirmatively indicateMeeting (although attendance at the Annual Meeting their intention to votewill not in person the shares represented by their proxy.and of itself constitute a revocation of a proxy). In addition, a shareholder may revoke their proxy by submitting a subsequent proxy by Internet or telephone by following the instructions in the Notice.telephone.
Quorum
The holders of a majority of the total shares of Common Stock outstanding on the Record Date, whether present at the Annual Meeting in person, or represented by proxy (including by voting through the Internet or telephone, or represented by proxy,telephone), will constitute a quorum for the transaction of business at the Annual Meeting. We will not count abstentions and “broker non-votes” toward fulfillment of quorum requirements. Broker non-votes occur on a matter up for vote when a broker, bank, or other custodian or nominee is not permitted to vote on that particular matter without instructions from the beneficial owners of the shares, the owner does not give those instructions, and the broker or other nominee indicates on its proxy, or otherwise notifies us, that it does not have authority to vote the shares on that matter. Whether a broker has authority to vote its shares on uninstructed matters is determined by stock exchange rules.
Counting of Votes
The purpose of the Annual Meeting is to consider and act on the matters listed in the accompanying Notice of Annual Meeting and set forth in this Proxy Statement. The voting methods described in the Notice provide a means for a shareholder to vote on each of the matters listed in the Notice and described in this Proxy Statement. Shares represented by each proxy will be voted in accordance with the shareholder’s directions.
Assuming a quorum is present, approval of the nonbinding resolution to approve the compensation of the Company’s named executive officers and ratification of the appointment of Ernst & Young LLP as our independent registered public accounting firm for the fiscal year ending December 31, 2018, and approval of any other matters as may properly come before the meeting, require2021, requires that the votes cast in favor of each matter exceed the votes cast against that matter.
The Company’s Bylaws provide that Directors are elected by a plurality of the votes cast for the Directors; i.e., the nominees who receive the most votes for the available Director positions will be elected as Directors. As described in the next section below,“Majority Vote Resignation Policy for Director Elections” on page 17, however, the Board has adopted a policy requiring Director nominees who fail to receive the affirmative vote of a majority of the votes cast in an uncontested election to tender their resignation.
Neither abstentions nor broker non-votes are considered “votes cast,” and therefore neither will have an effect on the results of the vote with respect to the election of Directors, approval of the nonbinding resolution to approve the compensation of the Company’s named executive officers, or ratification of the appointment of Ernst & Young LLP as our independent registered public accounting firm for the fiscal year ending December 31, 2018.2021.
Proxies
When a proxy is properly executed and returned, the shares that it represents will be voted at the Annual Meeting in accordance with the instructions noted on it. In the absence of instructions, the shares represented by valid proxies will be voted in accordance with the Board’s recommendations.
44
shareholder of record vs Beneficial owner
If your shares of Common Stock are registered directly in your name with our transfer agent, Computershare Trust Company, NA, you are considered the shareholder of record of those shares.
If your shares of Common Stock are held by a broker, bank or other nominee (e.g., in “street name”), you are considered the beneficial owner of those shares. You should receive instructions from your nominee, which you must follow to have your shares voted – the instructions may appear on a Notice or a special type of proxy card provided to you by your nominee (also called a “voting instruction form”). Your nominee may offer you different methods of voting than those available to record holders. If you do hold your shares in “street
48
“street name” and plan on attending the Annual Meeting, you should request a proxy from your broker or other nominee holding your shares in record name on your behalf to attend the Annual Meeting and vote at that time (your broker or other nominee may refer to it as a “legal” proxy).
PRoxy Solicitation Costs
The Company will bear the entire cost of soliciting proxies to be voted at the Annual Meeting, including the preparation and, as applicable, the printing and mailing of the proxy materials and tabulation of the votes. We have engaged The Proxy Advisory Group, LLC, to assist in the solicitation of proxies and provide related advice and informational support, for a services fee and the reimbursement of customary disbursements that are not expected to exceed $20,000 in the aggregate. In addition, certain Directors, officers, or other employees of the Company, who will receive no additional compensation for their services, may solicit proxies in person or by telephone, email, or facsimile. The Company will reimburse brokers, banks, and other nominees for their reasonable out-of-pocket expenses for forwarding the proxy materials to their customers who are beneficial owners.
SEC rules require that any proposal by a shareholder of the Company for consideration at the 20192022 Annual Meeting of Shareholders must be received by the Company no later than November 30, 2018,29, 2021, if it is to be eligible for inclusion in the Company’s proxy materials for its 20192022 Annual Meeting. Under those rules, the Company is not required to include shareholder proposals in its proxy materials unless certain other conditions specified in those rules are metmet.
In order for a shareholder to bring any business or nominations before the Annual Meeting of Shareholders, certain conditions set forth in Sections 2.14 and 3.8 of the Company’s Bylaws must be met, including, but not limited to, delivery of notice to the Company not less than 60 days prior to the meeting as originally scheduled, or if less than 70 daysdays’ notice or prior public disclosure of the date of the scheduled meeting is given or made, delivery of notice to the Company not later than the tenth day following the earlier of the day on which notice of the date of the meeting is mailed to shareholders or public disclosure of the date of that meeting is made.
Communication with Directors
We have established procedures for shareholders or other interested parties to communicate directly with our Board of Directors. TheyThose parties can contact the Board by email at: investor_relations@manh.com or by mail at: Manhattan Associates, Inc. Board of Directors, 2300 Windy Ridge Parkway, Tenth Floor, Atlanta, Georgia 30339. The Chairman of the Audit Committee will receive directly all communications made by this means.
Our Form 10-K for the fiscal year endingended December 31, 2017,2020, which is part of our Annual Report to Shareholders, including the financial statements, schedules, and list of exhibits, is available at our website, www.manh.com. We will mail without charge, upon written request, a copy of our Form 10-K and exhibits. Please send requests to Manhattan Associates, Inc., 2300 Windy Ridge Parkway, Tenth Floor, Atlanta, Georgia 30339. They are also available, free of charge, at the SEC’s web site, www.sec.gov.
Company management is not aware of any other matter to be presented for action at the Annual Meeting other than those mentioned in the Notice of Annual Meeting of Shareholders and referred to in this Proxy Statement. However, if any other matter requiring a vote
45
of the shareholders arises, the accompanying proxyindividuals acting as proxies will have discretionary authority to vote confers discretionary authority on the representatives named on the proxy to vote, to the extent permitted by law, in accordance with their best judgment.
49
Forward-Looking Statements
This Proxy Statement contains “forward-looking statements” relating to the Company. Forward-looking statements in this Proxy Statement include, without limitation, statements we make about expansion of our addressable market, positioning the Company for future success and to deliver long-term sustainable growth and shareholder returns, and other statements identified by words such as “may,” “expect,” “forecast,” “anticipate,” “intend,” “plan,” “believe,” “could,” “seek,” “project,” “estimate,” and similar expressions. Shareholders are cautioned that any such forward-looking statements are not guarantees of future performance and involve risks and uncertainties, and that actual results may differ materially from those contemplated by such forward-looking statements. Among the important factors that could cause actual results to differ materially from those indicated by such forward-looking statements are: uncertainty about the global economy, including the effects on global commerce of the spread of the novel coronavirus strain known as COVID-19,risks related from transitioning our business from a traditional perpetual license software company (generally hosted by our customers on their own premises and equipment) to a subscription-based software-as-service/software-as-a-service/cloud-based model, delays in product development, competitive pressures, software errors, information security breaches and other IT system risks and the risk factors set forth in Item 1A of the Company’s Annual Report on Form 10-K for the year ended December 31, 2017.2020. We undertake no obligation to update or revise forward-looking statements to reflect changed assumptions, the occurrence of unanticipated events or changes in future operating results.
| BY ORDER OF THE BOARD OF DIRECTORS, |
|
|
|
|
| Bruce S. Richards |
| Senior Vice President, Chief Legal Officer and Secretary |
on reverse sideV.1.1
4650
2300 WINDY RIDGE PARKWAY TENTH FLOOR ATLANTA, GEORGIA 30339
Logo VOTE BY INTERNET - www.proxyvote.com Use the Internet to transmit your voting instructions and for electronic delivery of information up untilinformation. Vote by 11:59 p.m. Eastern Time the day before the cut-off date or meeting date.P.M. ET on May 12, 2021. Have your proxy card in hand when you access the web site and follow the instructions to obtain your records and to create an electronic voting instruction form. ELECTRONIC DELIVERY OF FUTURE PROXY MATERIALS If you would like to reduce the costs incurred by our company in mailing proxy materials, you can consent to receiving all future proxy statements, proxy cards and annual reports electronically via e-mail or the Internet. To sign up for electronic delivery, please follow the instructions above to vote using the Internet and, when prompted, indicate that you agree to receive or access proxy materials electronically in future years. VOTE BY PHONE - 1-800-690-6903 Use any touch-tone telephone to transmit your voting instructions up untilinstructions. Vote by 11:59 p.m. Eastern Time the day before the cut-off date or meeting date.P.M. ET on May 12, 2021. Have your proxy card in hand when you call and then follow the instructions. VOTE BY MAIL Mark, sign and date your proxy card and return it in the postage-paid envelope we have provided or return it to Vote Processing, c/o Broadridge, 51 Mercedes Way, Edgewood, NY 11717. TO VOTE, MARK BLOCKS BELOW IN BLUE OR BLACK INK AS FOLLOWS: THIS PROXY CARD IS VALID ONLY WHEN SIGNED AND DATED. KEEP THIS PORTION FOR YOUR RECORDS DETACH AND RETURN THIS PORTION ONLY2300 WINDY RIDGE PARKWAY TENTH FLOOR ATLANTA, GEORGIA 30339 D36311-P50472 MANHATTAN ASSOCIATES, INC. The Board of Directors recommends ayou vote FOR the nominees listed:following: 1. Election of Directors NomineesNominees: Against Abstain For ! ! ! 1a. Deepak Raghavan ! ! ! 1b. Edmond I. Eger III ! ! ! 1c. Linda T. Hollembaek For Against Abstain The Board of Directors recommends ayou vote FOR proposals 2 and 3. For Against Abstain ! ! ! 2. Nonbinding resolution to approve the compensation of the Company's named executive officers. ! ! ! 3. Ratification of the appointment of Ernst & Young LLP as the Company's independent registered public accounting firm for the fiscal year ending December 31, 2018. For address change/comments, mark here. (see reverse for instructions)2021. Please sign exactly as your name(s) appear(s) hereon. When signing as attorney, executor, administrator, or other fiduciary, please give full title as such. Joint owners should each sign personally. All holders must sign. If a corporation or partnership, please sign in full corporate or partnership name by authorized officer. Signature [PLEASE SIGN WITHIN BOX] Date Signature (Joint Owners) Date0000368786_1 R1.0.1.17
1
Important Notice Regarding the Availability of Proxy Materials for the Annual Meeting:The Notice and Proxy Statement and Annual Report are available at www.proxyvote.com .www.proxyvote.com. D36312-P50472 MANHATTAN ASSOCIATES, INC. 2300 Windy Ridge Parkway Tenth Floor Atlanta, Georgia 30339 THIS PROXY IS SOLICITED ON BEHALF OF THE BOARD OF DIRECTORS By this proxy, the undersigned (i) appoints Eddie Capel and Bruce S. Richards, and each of them, with full power of substitution, as their proxy to represent and vote all the shares of Common Stock of Manhattan Associates, Inc. held of record by the undersigned on March 21, 2018,19, 2021, at the annual meetingAnnual Meeting of shareholdersShareholders to be held on May 17, 2018,13, 2021, or any adjournment or postponement of that meeting, as designeteddesignated on the reverse side of the Proxy, (ii) confirm all that those proxies may lawfully do by virtue of their appointments, and (iii) revoke any proxy appiontmentsappointments as to those shares previously given by the undersigned. The proxies, in their discretion, are further authorized to vote (x) on any matter of which the company did not have notice at least 45 days before the date of this solicitation, or the date provided for in Section 2.14 of the company's bylaws, whichever date is earlier, (y) for the election of a person to the Board if any Board- recommendedBoard-recommended nominee becomes unable to serve or for good cause will not serve and (z) matters incident to the conduct of the annual meetingAnnual Meeting and any other matters that may properly come before the meeting and any adjournments or postponements of the meeting. The shares represented by this Proxy will be voted as directed by the undersigned. If no direction is given when the duly executed Proxy is returned, those shares will be voted "FOR" the Nominees in Proposal 1 and "FOR" Proposals 2 and 3. The undersigned understands that this Proxy confers discretionary authority with respect to matters not known or determined at the time of the mailing of the notice of the meeting to the undersigned. Address change/comments: (If you noted any Address Changes and/or Comments above, please mark corresponding box on the reverse side.) Continued on reverse side 000368786_2 R1.0.1.17